Quantitative Assessment of Hyaline Cartilage Elasticity During Optical Clearing Using Optical Coherence Elastography
Tissue optical clearing is an emerging technique for dynamically modifying tissue optical properties to increase imaging depth, which is useful in applications such as imaging and functional diagnostics of many diseases. For example, optical clearing of cartilage allowed imaging of subchondral bone that is used to assess orthopedic diseases. However, the effect of the clearing processes on tissue elastic properties has not been investigated yet. In this study we report the first use of phase-stabilized swept source optical coherence elastography (PhS-SSOCE) to quantitatively monitor the change in elasticity of hyaline cartilage during the optical clearing process noninvasively. The results showed that PhS-SSOCE was able to assess the increase in cartilage stiffness during the clearing process over time and with different concentrations of glucose. In addition, the results demonstrated that the elasticity of the cartilage was reversed once the clearing agent was replaced with saline. To verify the results obtained from the PhS-SSOCE measurements, benchmark mechanical testing was performed using a uniaxial mechanical compression frame. Both methods demonstrated the same trend of the elasticity change of the cartilage immersed in glucose solution. The data show that during the transition from phosphate buffered saline to the clearing agent, the cartilage stiffness decreases significantly, which indicates that the clearing agent diffused into the cartilage extracellular matrix and decreased the tissue elasticity due to dehydration. Therefore, the proposed optical coherence elastography can dynamically assess the effects of optical clearing and associated changes in tissue biomechanical properties noninvasively and nondestructively. This technique may be potentially useful in orthopedic studies such as early detection and monitoring of osteoarthritic diseases.
Introduction. Biomechanical properties, such as elasticity, are important for characterizing hyaline cartilage health and structural integrity. Tissue optical clearing is a technique for dynamically modifying tissue optical properties to increase imaging depth, which is useful in applications such as imaging and functional diagnostics of many diseases [1]. Currently, the optical coherence tomography (OCT) structural image is widely used to monitor the optical clearing process by assessing the change in the optical properties of the sample [2]. Glucose is a commonly used clearing agent, due to its natural biocompatibility at topical application [3–10]. The OCT based method of elastography, termed optical coherence elasto graphy (OCE), is a technique for assessing the biomechanical properties of tissues by imaging displacements induced by external mechanical loading [11–13]. Previously we have used OCE to assess the elastic properties of various tissues, such as the cornea [14, 15], soft-tissues tumors [16], and cardiac muscle [17]. However, the effect of the clearing processes on tissue elastic properties has not been investigated yet.
In this study, we report the first (to the best of our knowledge) use of OCE to quantify the elasticity change of the hyaline cartilage during the optical clearing process utilizing glucose solutions of various concentrations. A phase-stabilized swept source optical coherence elastography (PhS-SSOCE) system, which combines a focused air-pulse delivery device and a phase-stabilized swept source OCT system (PhS-SSOCT), was employed to image an induced elastic wave in the hyaline cartilage. Utilizing the velocity of the elastic wave, the stiffness of the hyaline cartilage was quantified and monitored during the clearing process. In addition to elastographic measurements, speckle variance and optical attenuation were also computed to assess the glucose diffusion process [18, 19].
Materials and Methods
Phase-stabilized swept source optical coherence elastography system. A custom-built PhS-SSOCE system was utilized to assess the elasticity of the cartilage during the clearing process. The PhS-SSOCE system was comprised of a focused air-pulse delivery system combined with a PhS-SSOCT system [20]. A schematic of the system setup is shown in Figure 1. In brief, the system utilized a broadband swept laser source (HSL2000, Santec Inc., USA) with a central wavelength of 1310 nm, bandwidth of ~150 nm, and scan rate of 30 kHz. The axial resolution of the system was ~11 µm in air with an experimentally measured phase stability of 16 mrad (corresponding to ~3.3 nm in air). A-scan acquisition was triggered by a fiber Bragg grating.
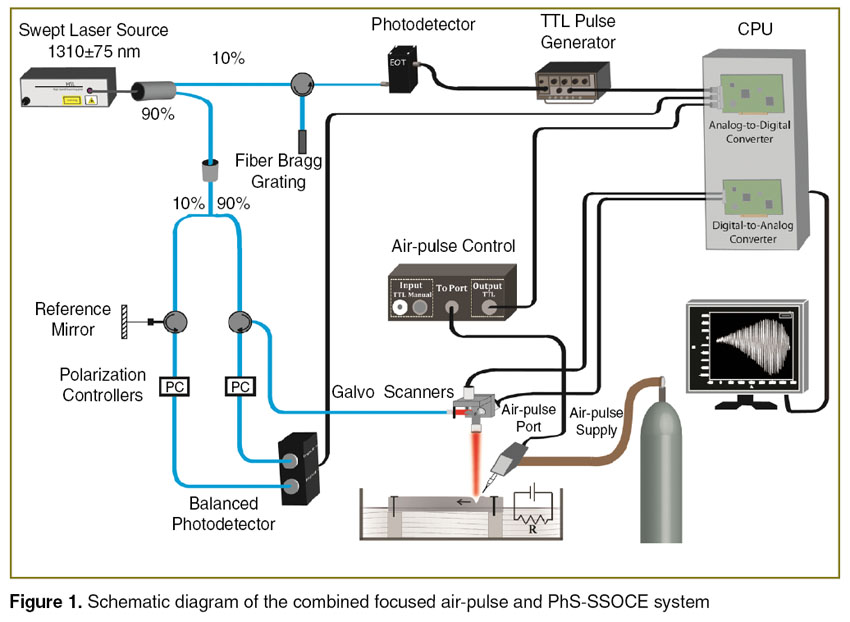 Figure 1. Schematic diagram of the combined focused air-pulse and PhS-SSOCE system Figure 1. Schematic diagram of the combined focused air-pulse and PhS-SSOCE system
|
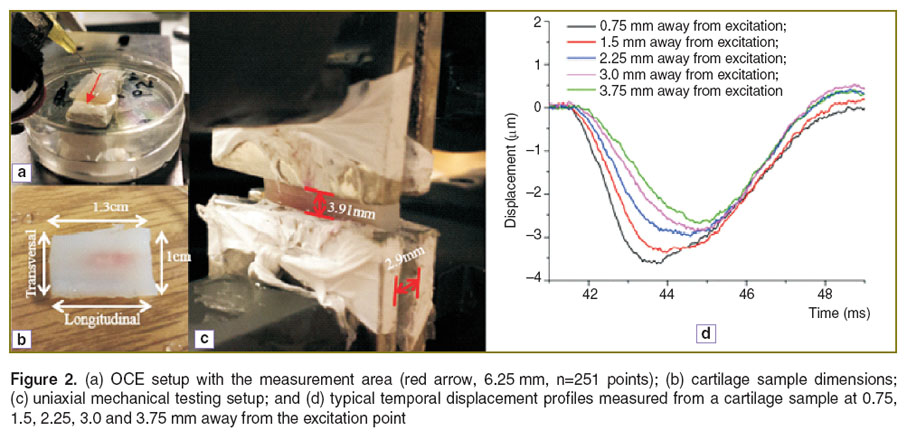
The PhS-SSOCT system was synchronized with the home-built focused air-pulse delivery system. The air-pulse delivery system was capable of delivering a short duration (≤1 ms) focused air-pulse to induce an elastic wave in the sample, which was imaged by the PhS-SSOCT system. The air-pulse was expelled out of a cannula port with a flat edge and diameter of ~150 µm. The elastic wave was excited with a pressure of ~26 Pa. The air-pulse excitation was positioned precisely using a 3D linear micrometer stage. The position of the needle and size of the sample are illustrated in Figure 2 (a), (b). M-mode imaging was performed at successive locations in a line along the elastic wave propagation path. By synchronizing the air-pulse with the M-mode images, a two dimensional depth resolved elasticity map can be generated [14].
Samples. Fresh porcine nasal septa (J&J Packing Company Inc., USA) were dissected into rectangular shapes as illustrated in Figure 2 (b) (height: 2.9 mm; width: 1.3 cm; length: 1 cm) for elasticity assessment. Samples were then cut in half, width-wise; one sample was used for PhS-SSOCE, and the other sample was used for uniaxial mechanical testing. This ensured minimal variability between the samples used for assessment by the two methods. Before all measurements, the cartilage samples were immersed in 0.9% saline for at least 2 hours and kept hydrated during measurements in order to prevent dehydration. During the OCE measurements, the sample edges were secured leaving the central region of the sample free of contact in order to minimize the influence of rigid boundaries. All measurements were taken from the central region of the sample. The entire sample, other than the upper surface, was immersed in the appropriate solution during the OCE measurements.
Different glucose concentrations (20, 30, 40, and 70% w/w) were used as optical clearing agents to study the effects of the concentration gradient on the clearing process kinetics. As a control, the hyaline cartilage samples were immersed in 1X phosphate buffered saline (PBS) before application of the clearing agent.
Uniaxial mechanical compression testing. To verify the results obtained from the PhS-SSOCE measurements, benchmark mechanical testing was performed using a uniaxial mechanical compression frame (Model 5943, Instron Inc., USA). The compressional stress was applied in one direction, as shown in Figure 2 (c). During the compression testing, the terminal edges of the cartilage samples were fixed by mechanical clamps. The distance between the clamps was 3.91 mm. The maximal compressive strain was set at 2.5% as this value was experimentally determined to be in the elastic range of the sample, which was in agreement with previous studies [21]. During all mechanical testing, the samples were completely immersed in the respective solution. The slope of the most linear region of the stress-strain curve was used to automatically calculate the Young’s modulus by the instrument’s software.
Quantification of elasticity from OCE measurements
Elastic wave group velocity. The displacement, δx(t), was calculated from the phase by the following equation:

where λ0 is the central wavelength of the laser source, and ∠I(x, t) is the phase of OCT signal. The displacement profiles δx(t) at different OCE measurement positions are plotted in Figure 2 (d). The displacement profiles were normalized to a maximal displacement of –1 and cross-correlated to determine the time delay of the elastic wave to propagate from a reference position near the excitation to each of the OCE measurement positions. The velocity of the elastic wave,  , was computed from the time delay, t, of the elastic wave propagation to each measurement position, d, by

Due to the limited light penetration depth in the cartilage samples, we selected a computation window of 0.1 to 0.5 mm below the sample surface. The computed velocities in a given depth were then averaged as the elastic wave velocity for that given depth. The median velocity of all the imaged depths was then used as the elastic wave velocity to calculate Young’s modulus. Since the air-pulse excites the sample surface and the computation window is close to the surface, the relationship between Young’s modulus and elastic wave velocity can be achieved based on the surface wave equation [16, 20]:

where ρ is the tissue density 1200 kg/m3 [22], and γ is the Poisson ratio 0.5 [23], and  is the group wave velocity.
Speckle variance. Speckle variance of the OCT signal fluctuation reflects the refractive index mismatches at different depths in the sample and was used to study the kinetics of clearing process. Speckle variance was quantified from the standard deviation of the OCT A-line intensity profile after removing the linear slope [18, 19]. Here, the measured positions used for PhS-SSOCE were also used for calculating speckle variance. To calculate speckle variance, a linear fit was performed on the A-line intensity profile as depicted in Figure 3 (a). This slope was then subtracted from the A-line intensity profile, which resulted in a zero mean intensity signal, as shown in Figure 3 (b). The Standard deviation (SD) [24] of this slope-removed signal was then quantified as Speckle variance.
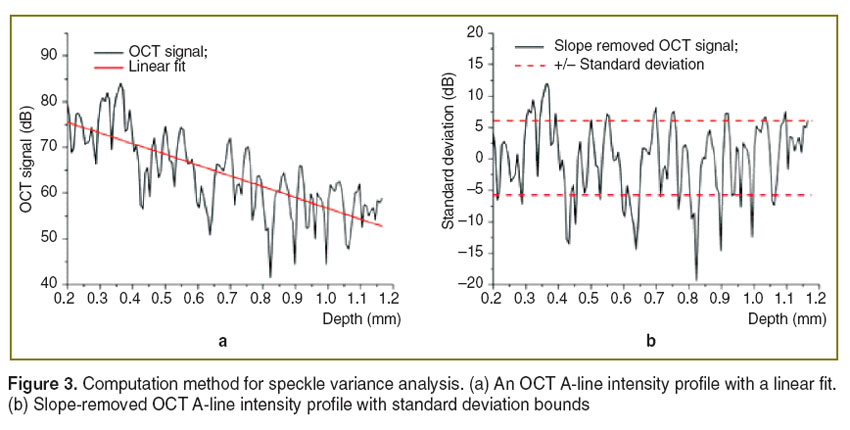 Figure 3. Computation method for speckle variance analysis. (a) An OCT A-line intensity profile with a linear fit. (b) Slope-removed OCT A-line intensity profile with standard deviation bounds Figure 3. Computation method for speckle variance analysis. (a) An OCT A-line intensity profile with a linear fit. (b) Slope-removed OCT A-line intensity profile with standard deviation bounds
|
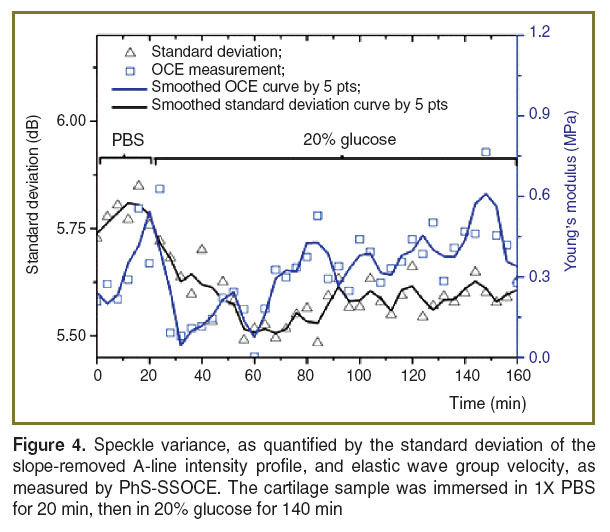
Results and Discussion. Optical clearing is used to increase the penetration depth of light in tissues. This can be observed by measuring the optical attenuation. In OCT, this can be quantified easily with the OCT signal slope [2, 4, 6, 7, 9, 10, 18, 19, 25–31]. However, in this study, the constant change of the fluid volume in the path of the probe beam resulted in dynamic defocusing of the OCT signal and, thus, affecting the values of the OCT signal slope. Thus, speckle variance, as quantified by the standard deviation of the slope-removed OCT A-line intensity profile, was utilized to monitor the refractive index mismatch dynamics during the clearing process. The standard deviation curve in Figure 4 shows that the glucose reduced the refractive index mismatch between collagen and extracellular fluid (as compared to 1X PBS) resulting in lower standard deviation values.
The temporal biomechanical properties of the cartilage samples were also assessed during glucose diffusion process using OCE. The Young’s modulus (obtained from OCE measurements) is plotted together with speckle variance as a function of time in Figure 4. The results demonstrate that glucose diffusion in the cartilage reduces its stiffness. However, the data also demonstrate that Young’s modulus gradually increases after an initial decrease indicating that the clearing process may be gradually reversing. A possible source for this clearing reversal is the diffusion of glucose out of the cartilage extracellular matrix during each mechanical compression measurement. Nevertheless, both the speckle variance and Young’s modulus quantified by OCE showed a similar trend suggesting that OCE has the ability to monitor the changes in the elastic properties of cartilage during the clearing process.
The data obtained by noncontact OCE measurements were further verified using “benchmark standard” uniaxial mechanical testing system. Figure 5 shows the discrepancy of Young’s modulus quantification using the two methods. A possible source of the difference in Young’s modulus is the anisotropy of the biomechanical properties of the cartilage tissues [22, 32]. The elasticity of the porcine nasal septum varies along the cranial-caudal axis. The cranial region has a lower elasticity than the caudal region. Another source of the discrepancy may be the orientation of the applied force [33]. In our experimental setup shown in Figure 2 (b), the air-pulse was applied on the top surface of the cartilage and the OCE measurement positions were in a line, as shown by the red arrow in Figure 2 (a), while the compression force of the mechanical test was conducted along the transverse axis as shown in Figure 2 (c). Therefore, the elasticity measured by each method may correspond to elasticity in different directions and from different regions of the tissue. During the mechanical testing, the compressional length of the cartilage was L=3.91 mm and the compressional area was A=2.9×13.0 mm. This corresponds to a ratio of L/(A0.5)<1, which may overestimate the Young’s modulus [34].
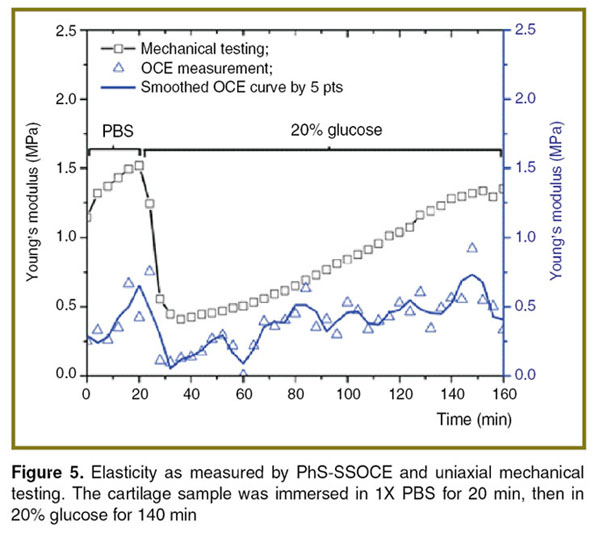 Figure 5. Elasticity as measured by PhS-SSOCE and uniaxial mechanical testing. The cartilage sample was immersed in 1X PBS for 20 min, then in 20% glucose for 140 min Figure 5. Elasticity as measured by PhS-SSOCE and uniaxial mechanical testing. The cartilage sample was immersed in 1X PBS for 20 min, then in 20% glucose for 140 min
|
However, it is worth mentioning that both methods demonstrate the same trend, which could be utilized to analyze the elasticity change of the cartilage by the solution. The data show that during the transition from PBS to the clearing agent, the cartilage stiffness (both assessed by both PhS-SSOCE and mechanical testing) decreases significantly, which indicates that the clearing agent diffused into the cartilage extracellular matrix and decreased the tissue elasticity due to dehydration.
The large variance in OCE results as compared to mechanical testing may be associated with temporal resolution of the utilized OCE system. The ability to resolve the time delay of the elastic wave propagation is determined by the laser source sweep rate, which is 30 kHz in our case and corresponds to ~0.033 ms per pixel. Since the cartilage is stiffer than most soft tissues, the induced elastic wave has a relatively fast propagation speed. This results in a limited number of pixels which can be used for assessing the wave propagation. Subsequently, there is a relatively large variance of the elastic wave velocity calculation. However, the noninvasive and nondestructive nature of OCE measurements is very attractive for tissue mechanical characterization.
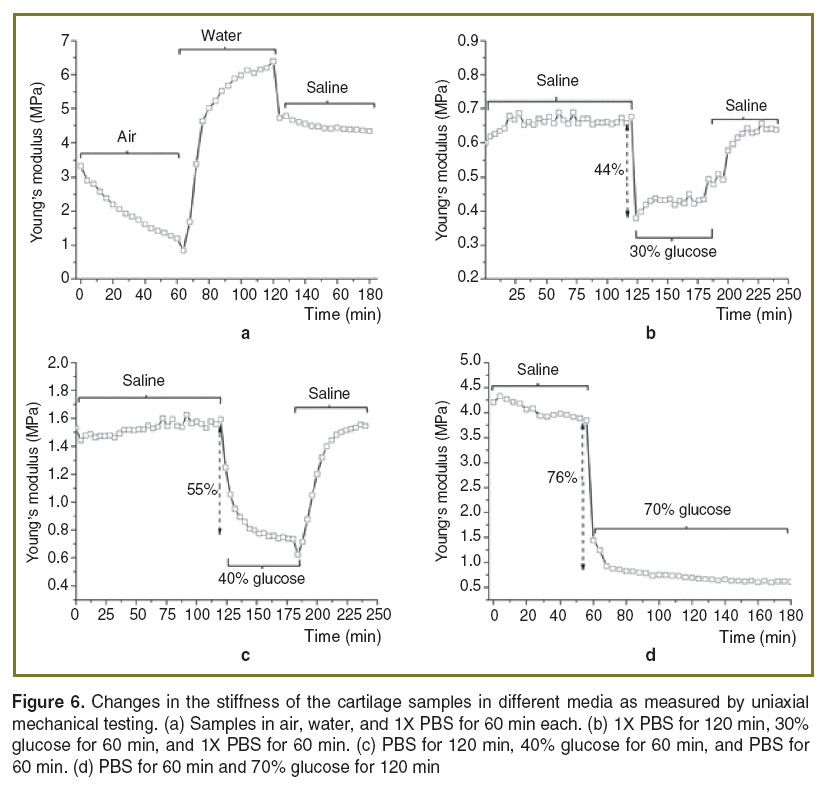
To verify the elasticity change caused by dehydration, the cartilage samples were placed in air, then water, and then saline for 60 min at each step and their elasticity was monitored by mechanical testing, as shown in Figure 6 (a). The results clearly demonstrate that dehydration of the cartilage decreased the sample stiffness and hydration increased the stiffness. This can be explained by the amount of free and “free and bound” water in the hyaline cartilage extracellular matrix, which was confirmed by infrared spectroscopy [35, 36]. Bound water refers to the water bound to glycosaminoglycans, while free water refers to the water in the liquid state existing in pores or interstitial spaces within the cartilage. When the cartilage was mechanically loaded, negatively charged groups of proteoglycans experienced electrostatic repulsion due to compression. However, the dehydration of cartilage at room temperature usually does not induce a substantial transition of water from a bound to a free state, which occurs at the temperature about 70°C [36], causing positively charged sodium and calcium ions to remain between the negatively charged proteoglycans. The Ca2+ and Na+ ions reduce the internal repulsion force of the proteoglycans [37]. If the positively charged ions and negative charged groups of proteoglycans form a stable complex, the Young’s modulus should decrease [37]. This elasticity change caused by dehydration is reversible by rehydration [38]. In Figure 6 (a), after 120 min, the water was replaced by saline, demonstrating that the tissue hydrated by only water has a higher stiffness than the dehydrated collagen-glycosaminoglycan tissue. In addition, during the 20 and 30% glucose immersion, the stiffness of the cartilage gradually increased after a precipitous drop, as shown in Figure 5 and Figure 6 (b). This may be due to water gradually diffusing back into the extracellular matrix to replace glucose, which was forced out from the cartilage by mechanical compression.
Further study of these findings is needed to fully establish these proposed mechanisms. To study the effect of glucose concentration on the change in stiffness, the cartilage was also immersed in 40 and 70% glucose during mechanical testing. The trend of gradually increasing stiffness was not observed during immersion in these higher concentrations of glucose as shown in Figure 6 (c), (d), which may be due to the higher concentration gradient of glucose. From Figure 6 (b), it can be seen that when the cartilage was immersed in 30% glucose after reaching equilibrium in PBS, the stiffness decreased by 44%. When the cartilage was immersed in 40% glucose after reaching equilibrium in PBS, the stiffness decreased by 55%, as depicted in Figure 6 (c). Figure 6 (d) shows that after the cartilage was immersed in 70% glucose, the stiffness decreased 76% from the equilibrium stiffness in PBS. Higher concentrations of glucose created a greater concentration gradient, thus causing more water to diffuse out of the cartilage extracellular matrix and reduce the cartilage stiffness. Furthermore, the change in stiffness observed during the transition of water from bound to free state is reversible by rehydration [38], which can be seen in Figure 6 (a). In addition, comparing Figure 6 (b)–(d), the observed longest diffusion time is during the 40% glucose application. This finding is similar with the literature, which also showed that the balance of the water content between the immersion medium and the cartilage slows down the diffusion rate [39]. Since fluid movement can affect cartilage stiffness, it can also play an important role in the process of cartilage regeneration [40]. Consequently, PhS-SSOCE and optical clearing can be potentially useful for early detection of cartilage diseases and monitoring the dynamics of laser-induced cartilage repair.
Conclusions. Optical clearing has been traditionally used to increase the penetration depth of light to image deeper structures in tissues. However, the changes in the biomechanical properties of the tissues due to the diffusion of the clearing agent into the tissue have not been fully investigated. In this study, we have shown that application of higher concentrations of glucose, which is a commonly used clearing agent, resulted in a greater decrease of the stiffness of hyaline cartilage. This is due to the clearing agent replacing water in the extracellular matrix and partly dehydrating the cartilage, causing the observed change in stiffness. The elasticity changes obtained from PhS-SSOCE were verified by uniaxial mechanical testing showing the ability of PhS-SSOCE to detect the stiffness changes of hyaline cartilage during the clearing process. This demonstrates the feasibility of PhS-SSOCE to detect and monitor cartilage mechanical properties during various surgical and imaging procedures. Future work would involve using mechanical modeling and numerical methods to assess viscosity changes in addition to elasticity, which could be used to fully characterize the hydration of the cartilage.
Acknowledgements. This work was supported, in part, by grants 1R01EY022362, 1R01HL120140, and U54HG006348 from the NIH and PRJ71TN from DOD/NAVSEA. VVT was supported by Russian Presidential grant NSh-703.2014.2, Russian Governmental grant 14.Z50.31.0004, and Tomsk State University Academic D.I. Mendeleev Fund Program.
Conflict of Interest. The authors have no conflict of interests to disclose.
References
- Zhu D., Larin K.V., Luo Q., Tuchin V.V. Recent progress in tissue optical clearing. Laser Photon Rev 2013; 7(5): 732–757, http://dx.doi.org/10.1002/lpor.201200056.
- Larin K.V., Ghosn M.G., Bashkatov A.N., Genina E.A., Trunina N.A., Tuchin V.V. Optical clearing for OCT image enhancement and in-depth monitoring of molecular diffusion. IEEE J Sel Top Quantum Electron 2012; 18: 1244–1259, http://dx.doi.org/10.1109/jstqe.2011.2181991.
- Zhao Q.L., Si J.L., Guo Z.Y., Wei H.J., Yang H.Q., Wu G.Y., Xie S.S., Li X.Y., Guo X., Zhong H.Q., Li L.Q. Quantifying glucose permeability and enhanced light penetration in ex vivo human normal and cancerous esophagus tissues with optical coherence tomography. Laser Phys Lett 2011; 8(1): 71–77, http://dx.doi.org/10.1002/lapl.201010081.
- Ghosn M.G., Sudheendran N., Wendt M., Glasser A., Tuchin V.V., Larin K.V. Monitoring of glucose permeability in monkey skin in vivo using optical coherence tomography. J Biophotonics 2010; 3(1–2): 25–33, http://dx.doi.org/10.1002/jbio.200910075.
- Larina I.V., Carbajal E.F., Tuchin V.V., Dickinson M.E., Larin K.V. Enhanced OCT imaging of embryonic tissue with optical clearing. USA, CA; 2009.
- Ghosn M.G., Carbajal E.F., Befrui N.A., Tuchin V.V., Larin K.V. Differential permeability rate and percent clearing of glucose in different regions in rabbit sclera. J Biomed Opt 2008; 13(2): 021110, http://dx.doi.org/10.1117/1.2907699.
- Ghosn M.G., Carbajal E.F., Befrui N.A., Tellez A., Granada J.F., Larin K.V. Permeability of hyperosmotic agent in normal and atherosclerotic vascular tissues. J Biomed Opt 2008; 13(1): 010505, http://dx.doi.org/10.1117/1.2870153.
- Larin K.V., Ghosn M.G., Ivers S.N., Tellez A., Granada J.F. Quantification of glucose diffusion in arterial tissues by using optical coherence tomography. Laser Phys Lett 2007; 4(4): 312–317, http://dx.doi.org/10.1002/lapl.200610111.
- Ghosn M.G., Tuchin V.V., Larin K.V. Nondestructive quantification of analyte diffusion in cornea and sclera using optical coherence tomography. Invest Ophthalmol Vis Sci 2007; 48(6): 2726–2733, http://dx.doi.org/10.1167/iovs.06-1331.
- Ghosn M.G., Tuchin V.V., Larin K.V. Depth-resolved monitoring of glucose diffusion in tissues by using optical coherence tomography. Opt Lett 2006; 31(15): 2314–2316, http://dx.doi.org/10.1364/OL.31.002314.
- Schmitt J.M. Optical coherence tomography (OCT): a review. IEEE J Sel Top Quantum Electron 1999; 5(4): 1205–1215, http://dx.doi.org/10.1109/2944.796348.
- Kennedy B.F., Kennedy K.M., Sampson D.D. A review of optical coherence elastography: fundamentals, techniques and prospects. IEEE J Sel Top Quantum Electron 2014; 20(2): 272–288, http://dx.doi.org/10.1109/jstqe.2013.2291445.
- Ko H.J., Tan W., Stack R., Boppart S.A. Optical coherence elastography of engineered and developing tissue. Tissue Eng 2006; 12(1): 63–73, http://dx.doi.org/10.1089/ten.2006.12.63.
- Wang S., Larin K.V. Shear wave imaging optical coherence tomography (SWI-OCT) for ocular tissue biomechanics. Opt Lett 2014; 39(1): 41–44, http://dx.doi.org/10.1364/OL.39.000041.
- Li J., Wang S., Singh M., Aglyamov S., Emelianov S., Twa M.D., Larin K.V. Air-pulse OCE for assessment of age-related changes in mouse cornea in vivo. Laser Phys Lett 2014; 11(6): 065601, http://dx.doi.org/10.1088/1612-2011/11/6/065601.
- Wang S., Li J., Manapuram R.K., Menodiado F.M., Ingram D.R., Twa M.D., Lazar A.J., Lev D.C., Pollock R.E., Larin K.V. Noncontact measurement of elasticity for the detection of soft-tissue tumors using phase-sensitive optical coherence tomography combined with a focused air-puff system. Opt Lett 2012; 37(24): 5184–5186, http://dx.doi.org/10.1364/OL.37.005184.
- Wang S., Lopez A.L., Morikawa Y., Tao G., Li J., Larina I.V., Martin J.F., Larin K.V. Noncontact quantitative biomechanical characterization of cardiac muscle using shear wave imaging optical coherence tomography. Biomed Opt Exp 2014; 5(7): 1980–1992, http://dx.doi.org/10.1364/boe.5.001980.
- Wang S., Liu C.-H., Zakharov V.P., Lazar A.J., Pollock R.E., Larin K.V. Three-dimensional computationalanalysis of optical coherence tomography images for the detection of soft tissue sarcomas. J Biomed Opt 2014; 19(2): 021102, http://dx.doi.org/10.1117/1.JBO.19.2.021102.
- Liu C.-H., Qi J., Lu J., Wang S., Wu C., Shih W.-C., Larin K.V. Improvement of tissue analysis and classification using optical coherence tomography combined with Raman spectroscopy. J Innov Opt Health Sci 2014; 1550006, http://dx.doi.org/10.1142/s1793545815500066.
- Wang S., Larin K.V., Li J., Vantipalli S., Manapuram R.K., Aglyamov S., Emelianov S., Twa M.D. A focused air-pulse system for optical-coherence-tomography-based measurements of tissue elasticity. Laser Phys Lett 2013; 10(7): 075605, http://dx.doi.org/10.1088/1612-2011/10/7/075605.
- Sobol E.N., Milner T.E., Shekhter A.B., Baum O.I., Guller A.E., Ignatieva N.Y., Omelchenko A.I., Zakharkina O.L. Laser reshaping and regeneration of cartilage. Laser Phys Lett 2007; 4(7): 488–502, http://dx.doi.org/10.1002/lapl.200710019.
- Diaz S.H., Aguilar G., Lavernia E.J., Wong B.J.F. Modeling the thermal response of porcine cartilage to laser irradiation. IEEE J Sel Top Quantum Electron 2001; 7(6): 944–951, http://dx.doi.org/10.1109/2944.983298.
- Ophir J., Alam S.K., Garra B.S., Kallel F., Konofagou E.E., Krouskop T., Merritt C.R.B., Righetti R., Souchon R., Srinivasan S., Varghese T. Elastography: imaging the elastic properties of soft tissues with ultrasound. J Med Ultrasonics 2002; 29(4): 155–171, http://dx.doi.org/10.1007/bf02480847.
- Peschke K.-D., Haasdonk B., Ronneberger O., Burkhardt H., Rösch P., Harz M., Popp J.R. Using transformation knowledge for the classification of Raman spectra of biological samples. In: Proceedings of the 24th IASTED international conference on biomedical engineering. 2006; p. 288–293.
- Ghosn M.G., Mashiatulla M., Mohamed M.A., Syed S., Castro-Chavez F., Morrisett J.D., Larin K.V. Time dependent changes in aortic tissue during cold storage in physiological solution. Biochim Biophys Acta 2011; 1810(5): 555–560, http://dx.doi.org/10.1016/j.bbagen.2011.02.003.
- Genina E.A., Bashkatov A.N., Tuchin V.V., Ghosn M.G., Larin K.V., Kamenskikh T.G. Cortexin diffusion in human eye sclera. Quantum Electron 2011; 41(5): 407–413, http://dx.doi.org/10.1070/qe2011v041n05abeh014641.
- Carbajal E.F., Baranov S.A., Manne V.G.R., Young E.D., Lazar A.J., Lev D.C., Pollock R.E., Larin K.V. Revealing retroperitoneal liposarcoma morphology using optical coherence tomography. J Biomed Opt 2011; 16(2): 020502, http://dx.doi.org/10.1117/1.3541789.
- Ivers S.N., Baranov S.A., Sherlock T., Kourentzi K., Ruchhoeft P., Willson R., Larin K.V. Depth-resolved imaging and detection of micro-retroreflectors within biological tissue using optical coherence tomography. Biomed Opt Exp 2010; 1(2): 367–377, http://dx.doi.org/10.1364/boe.1.000367.
- Manapuram R.K., Manne V.G.R., Larin K.V. Phase-sensitive swept source optical coherence tomography for imaging and quantifying of microbubbles in clear and scattering media. J Appl Phys 2009; 105(10): 102040, http://dx.doi.org/10.1063/1.3116614.
- Ghosn M.G., Leba M., Vijayananda A., Rezaee P., Morrisett J.D., Larin K.V. Effect of temperature on permeation of low-density lipoprotein particles through human carotid artery tissues. J Biophotonics 2009; 2(10): 573–580, http://dx.doi.org/10.1002/jbio.200810071.
- Ghosn M.G., Carbajal E.F., Befrui N.A., Tuchin V.V., Larin K.V. Concentration effect on the diffusion of glucose in ocular tissues. Optics and Lasers in Engineering 2008; 46(12): 911–914, http://dx.doi.org/10.1016/j.optlaseng.2008.05.004.
- Wong B.J., Chao K.K.H., Kim H.K., Chu E.A., Dao X., Gaon M., Sun C.-H., Nelson J.S. The porcine and lagomorph septal cartilages: models for tissue engineering and morphologic cartilage research. Am J Rhinol 2001, 15(2): 109–116, http://dx.doi.org/10.2500/105065801781543790.
- Chae Y., Aguilar G., Lavernia E.J., Wong B.J. Characterization of temperature dependent mechanical behavior of cartilage. Lasers Surg Med 2003; 32(4): 271–278, http://dx.doi.org/10.1002/lsm.10167.
- Jerabek M., Major Z., Lang R.W. Uniaxial compression testing of polymeric materials. Polymer Testing 2010; 29(3): 302–309, http://dx.doi.org/10.1016/j.polymertesting.2009.12.003.
- Padalkar M.V., Spencer R.G., Pleshko N. Near infrared spectroscopic evaluation of water in hyaline cartilage. Ann Biomed Eng 2013; 41(11): 2426–2436, http://dx.doi.org/10.1007/s10439-013-0844-0.
- Bagratashvili V.N., Sobol E.N., Sviridov A.P., Popov V.K., Omel’chenko A.I., Howdle S.M. Thermal and diffusion processes in laser-induced stress relaxation and reshaping of cartilage. J Biomech 1997; 30(8): 813–817, http://dx.doi.org/10.1016/S0021-9290(97)00028-6.
- Sobol E., Sviridov A., Omel’chenko A., Bagratashvili V., Kitai M., Harding S.E., Jones N., Jumel K., Mertig M., Pompe W., Ovchinnikov Y., Shekhter A., Svistushkin V. Laser reshaping of cartilage. Biotechnol Genet Eng Rev 2000; 17(1): 553–578, http://dx.doi.org/10.1080/02648725.2000.10648005.
- Liu C.H., Skryabina M.N., Li J., Singh M., Sobol E.N., Larin K.V. Measurement of the temperature dependence of Young’s modulus of cartilage by phase-sensitive optical coherence elastography. Quantum Electron 2014; 44(8): 751–156, http://dx.doi.org/10.1070/qe2014v044n08abeh015506.
- Oliveira L.M., Carvalho M.I., Nogueira E.M., Tuchin V.V. The characteristic time of glucose diffusion measured for muscle tissue at optical clearing. Laser Physics 2013; 23(7): 075606, http://dx.doi.org/10.1088/1054-660x/23/7/075606.
- Sobol E., Shekhter A., Guller A., Baum O., Baskov A. Laser-induced regeneration of cartilage. J Biomed Opt 2011; 16(8): 080902, http://dx.doi.org/10.1117/1.3614565.
