Features of Morphological Changes in Experimental CT-26 Tumors Growth
The aim of the investigation was to determine the optimal dates and morphological parameters of inoculated CT-26 tumors for evaluating the effectiveness of anti-cancer therapy. This was undertaken on the basis of morphological and morphometric investigations of the tumor growth dynamics by identifying the daily structural changes which were occurring.
Materials and Methods. The features of morphological changes in experimental tumors growth were evaluated on Balb/c mice using the mouse colon CT-26 adenocarcinoma inoculated onto the external side of mouse ear auricles (n=20). The inoculation dose in all cases was 2×10⁵ cells. The animals were removed by cervical dislocation on days 4, 8, 11, 17–19 or 20–22 after the inoculation. Each group consisted of four animals. The excised tumor was exposed to macroscopic and histological investigation. The specimens were stained by hematoxylin and eosin and picro-fuchsin using the Van-Gieson method. There were examined the quantitative composition of the cells the areas of the stroma and tumor parenchyma, the volume of the vascular bed, the area of necrosis and the presence of hemodynamic disruptions, the mitotic activity of the tumor cells.
Results. The study of the features of morphological changes in experimental tumors growth showed that tumor growth is determined not only by the mitotic activity of the cells, but also by the degree of the vascular bed development and its capacity for performing its required functional load to the full.
It was found that tumor angiogenesis is a fluctuating process which is, to a certain degree, connected with the state of the tumor cells. The formation of the vascular bed in the form of sinusoidal capillaries begins on day 4 after inoculation and it increases continuously until day 11. Between days 17–19 after inoculation there is a decrease in the proportion of vessels in the tumor tissue, but by days 20–22 this has increased again with the formation not only of sinusoidal capillaries, but also of vessels of larger diameters (to 200 µm).
The manifestations of spontaneous tumor regration are characterized by the occurrence of cells with irreversible damage to their nuclei and cytoplasm with a parallel decrease in their mitotic activity, and by the appearance of mosaically located areas of spontaneous necrosis. Spontaneous regression is also reflected in the observation of hemodynamic and hemorheologic disorders — plethora (hyperemia), stasis, the sludge-phenomenon and diapedetic hemorrhage. Here there is a connection between the severity of the changes associated with spontaneous regression and the relationship of the tumor volume to the degree of the vascular bed development.
When the tumor is small and the vascular network is well-developed, as is seen on day 11, spontaneous regression is revealed only by irreversible cell changes in a small number of tumor cells, while, by contrast, the bigger tumor size with a small number of vessels, as is registered on days 17–19, is characterized by a considerably greater number of dead cells (85%). The tumors of larger sizes observed on days 20–22 after inoculation, despite their more developed network of blood vessels, are characterized by a high level of spontaneous regression, which leads us to the conclusion that there is a mismatch between the level of angiogenesis in relation to the needs of the proliferating parenchymal elements.
Conclusion. The development of this carcinoma is characterized by two parallel processes: the formation of the tumor as a morphological substrate and the development of spontaneous regressive changes within it. The state of the tumor cells and the degree of development of spontaneous regressive changes depend on both the size of the tumor and on the level of development and functioning of the vascular network. These findings suggest that when using CT-26 tumors inoculated into mouse ears for evaluating the effectiveness of anti-cancer therapy periods of greater than 11 days should be avoided, as from this time there are evident manifestations of spontaneous pathomorphism in the tumor.
For several decades the CT-26 colorectal adenocarcinoma has been used as an experimental model of tumor growth and as an object for investigating the effectiveness of newly developed therapeutic tumor treatments among a number of other models. During these studies morphological features of the neoplasm, its mitotic activity and neoangiogenesis have been described. Moreover, some aspects of the dynamics of the tumor growth have been revealed [1–3].
In these studies CT-26 is characterized as an encapsulated anaplastic tumor consisting of cells varying in both size and the amount of nuclear-cytoplasmic correlation. A high content of mitotically dividing cells was noted (up to 5 in each view field), but at the same time there was no information provided about the stromal-parenchymal interrelations and no data about the processes reflecting its spontaneous regression [4]. The tumor vascular network characteristic is reduced to mosaic sinusoidal capillaries with average diameters ranging from 10 to 19 µm, but there is no information regarding possible hemorheological and hemodynamic disorders at site of the tumor [5]. The authors [6] state that the blood vessels visible within the tumor node at the beginning of carcinoma growth are the independent vascular network of the organ where the tumor has been inoculated, but that the issue of the start of neoangiogenesis in the experimental neoplasm is still unclear. Reports of the stage at which new vessels appear have ranged from 72 h after inoculation [7] to 2 weeks [4]. However this information is based on the use of CT-26 models with different localizations.
During our earlier development of innovative methods of instrumental diagnosis of neoplasms we faced solving a number of issues on which there was insufficient information or practically no information at all. These included the determination of the main development features of structural changes in the CT-26 experimental tumor, the evaluation of the microcirculation development dynamics in the tumor growth and finally the selection of an optimal model of the experimental tumor for evaluating the effectiveness of anti-cancer therapy.
The aim of the investigation was to determine the optimal dates and morphological parameters of inoculated CT-26 tumors for evaluating the effectiveness of anti-cancer therapy. This was undertaken on the basis of morphological and morphometric investigations of the tumor growth dynamics by identifying the daily structural changes which were occurring.
Materials and Methods. The features of morphological changes in experimental tumors growth were evaluated on Balb/c mice using the mouse colon CT-26 adenocarcinoma inoculated onto the external side of mouse ear auricles. While working with the animals we followed the Guidelines for Works Involving Experimental Animals [8] and the International Guiding Principles for Biomedical Research Involving Animals [9], we strictly followed the ethical principles established by the European Convention for the Protection of Vertebrate Animals used for Experimental and other Scientific Purposes (adopted on 18.03.1986 in Strasbourg and confirmed on 15.06.2006 in Strasbourg). The Ethical Committee of Nizhny Novgorod State Medical Academy approved the experimental tests on animals during the study.
The tumor was inoculated intracutaneously in the auricle in accordance with the approach of [10]. The inoculation dose in all cases was 2·105 cells. At 4 days after the inoculation and then on days 8, 11, 17–19 and 20–22 animals were removed by cervical dislocation. Four animals were extracted in this way at each sample time. The excised tumor was measured and then placed into a 10% solution of neutral formalin for 24 h for fixation. Pieces were cut from the fixed material to perform histological investigations. For this purpose they were embedded in paraffin (using Histomix-extra, BioVitrum, Russia) with subsequent mounting in paraffin blocks. Sections of these blocks with a thickness of 5–7 µm were made using a Leica 450RM (Leica Microsystems, Germany) rotation microtome. The sections were stained with hematoxylin and eosin and picro-fuchsin according to the Van-Gieson method. The histological preparations were observed with a Leica DM1000 (Leica Microsystems, Germany) light microscope, and micrographs were obtained using a Leica DFC290 (Leica Microsystems, Germany) digital camera. In addition to the microscopic description, morphometric investigations were performed on the quantitative composition of the cells, the region of the stroma and of the tumor parenchyma, the volume of the vascular bed region, the necrosis area and hemodynamic disturbances, plus an assessment of the mitotic activity of the tumor cells based on the methods of point calculation and fields proposed by Avtandilov [11].
Results and Discussion. The study began with investigation of the tumors on day 4 after the inoculation. At this early stage we could already see the formation of a tumor as a substrate node with an average volume of 0.8–1.0 mm3. Tumors in the early development stages were not immediately adjacent to the epidermis, a thin layer of dermis with blood-filled vessels could be detected between tumor cells and the basal layer. The carcinoma was of a histioid type and according to its microscopic structure was undifferentiated of degree IV malignancy (G) (Figure 1 (a)). As expected for a histioid tumor, stromal component was scarce, constituting only of an area of 0.35±0.2% of the neoplasm area while the parenchyma accounted for 99.6±0.3%. In deep parts of the tumor it was possible to identify individual sinusoidal blood-filled capillaries with diameters from 7 to 20 µm, accounting for 0.15±0.05% of the tumor, together with small arterioles which belonged to the dermis, and located within the carcinoma due to its growth infiltration (these were not taken into account in the calculation of the volume of the tumor vascular component). The tumor was characterized by a high level of proliferative activity, which was evidenced by the high number of mitotic cells — from 9 to 11 in the view field. No division pathology was recorded (Figure 1 (b)).
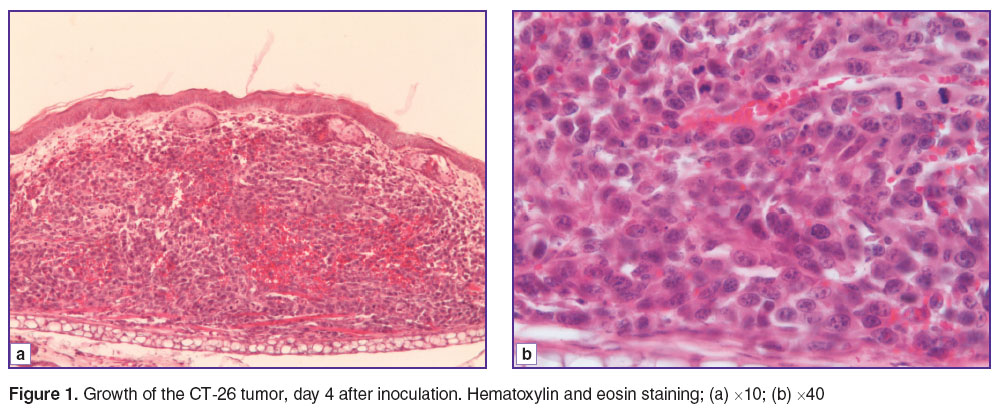 Figure 1. Growth of the CT-26 tumor, day 4 after inoculation. Hematoxylin and eosin staining; (a) ×10; (b) ×40 Figure 1. Growth of the CT-26 tumor, day 4 after inoculation. Hematoxylin and eosin staining; (a) ×10; (b) ×40
|
On day 8 after inoculation, the tumors had reached a volume of 7.1–8.4 mm3. They grew close to the epidermis but without invasion (Figure 2 (a)). The structure of the tumor remained typical, with high mitotic activity and sinusoidal vessels up to 21 μm in diameter, the total area of which was 0.10±0.03%. The vessels were blood-filled (Figure 2 (b)).
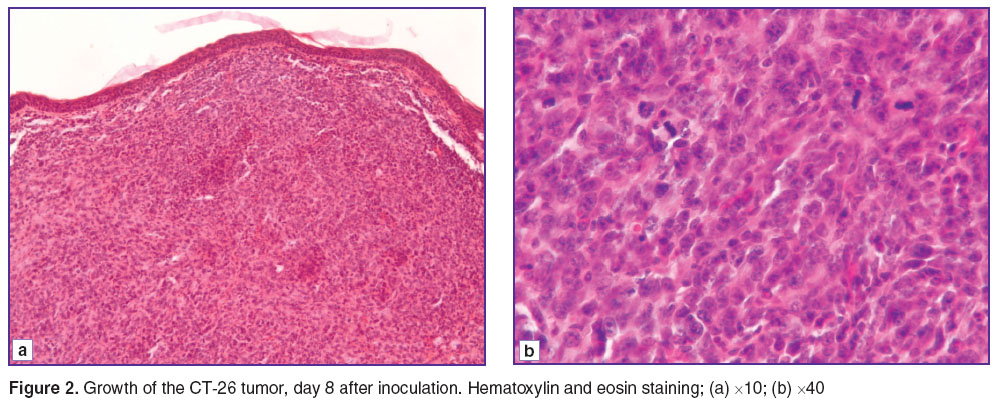 Figure 2. Growth of the CT-26 tumor, day 8 after inoculation. Hematoxylin and eosin staining; (a) ×10; (b) ×40 Figure 2. Growth of the CT-26 tumor, day 8 after inoculation. Hematoxylin and eosin staining; (a) ×10; (b) ×40
|
Observation of this group showed that, despite the increase in tumor volume, the composition of the vascular component had remained unchanged. This allows us refer to angiogenesis retardation of the tumor growth rate.
On day 11 after inoculation the tumor reached a volume of 11.2–12.4 mm3. In the epidermis, foci of necrosis could be seen infiltrated fibrin and leucocytes, together with the presence of ulceration due to invasive tumor growth. The tumor cells varied considerably in form and size, in 8.5% of cells irreversible changes in the nuclei were visible (karyopyknosis, karyorhexis and karyolysis). There were more than 10 mitoses per view field and most of them were pathological. The vascular component accounted for 1.5±0.1% of the neoplasm area. All the tumor vessels were sinusoidal type capillaries, with lumen diameters ranging from 7 to 21 μm, and all of them were blood-filled. Moreover, within the tumor there were visible scarce small diapedetic hemorrhages, diffusely located and without a clear topography. The observed changes in the cells and the hemodynamic disorders should be attributed to the start of spontaneous regressive changes (Figure 3).
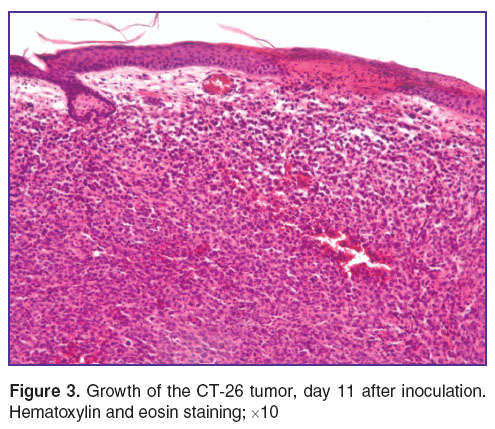 Figure 3. Growth of the CT-26 tumor, day 11 after inoculation. Hematoxylin and eosin staining; ×10 Figure 3. Growth of the CT-26 tumor, day 11 after inoculation. Hematoxylin and eosin staining; ×10
|
On days 17–19 after inoculation, the morphological picture differed from the previous one. The tumors volume had reached 16.8–20.3 mm3. The tumors were growing into the epidermis, and in their structure we could observe the manifestations of spontaneous necrosis located on the surface as well as at depth (Figure 4 (a)). In the neoplasm could be identified blood-filled vessels of a sinusoidal type up to 20 μm in the diameter, small diapedetic hemorrhages, stasis, and sludge-phenomenon. We noted the low proportion of the vascular component (0.6±0.2%). There were no foci of destruction of the general anatomical tumor structure (Figure 4 (b)), while in 85% of cells cytoplasmic damage had become fixed, and in 25% of them there was irreversible damage within the nuclei. Proliferative activity had decreased, with only 5 mitoses per view field, and all of them were pathological (Figure 4 (c)). We are of the opinion that the small vascular component in the tumor reflects angiogenesis retardation occurring in the period between days 11 and 17. This fact brings us to the conclusion that there is feedback involved in the implementation of the cellular–vascular interrelations. The large number of dying cellular elements, in their turn (in this case 85%), indicates angiogenesis retardation of proliferative potency causing weakening of the life support system of the tumor cells.
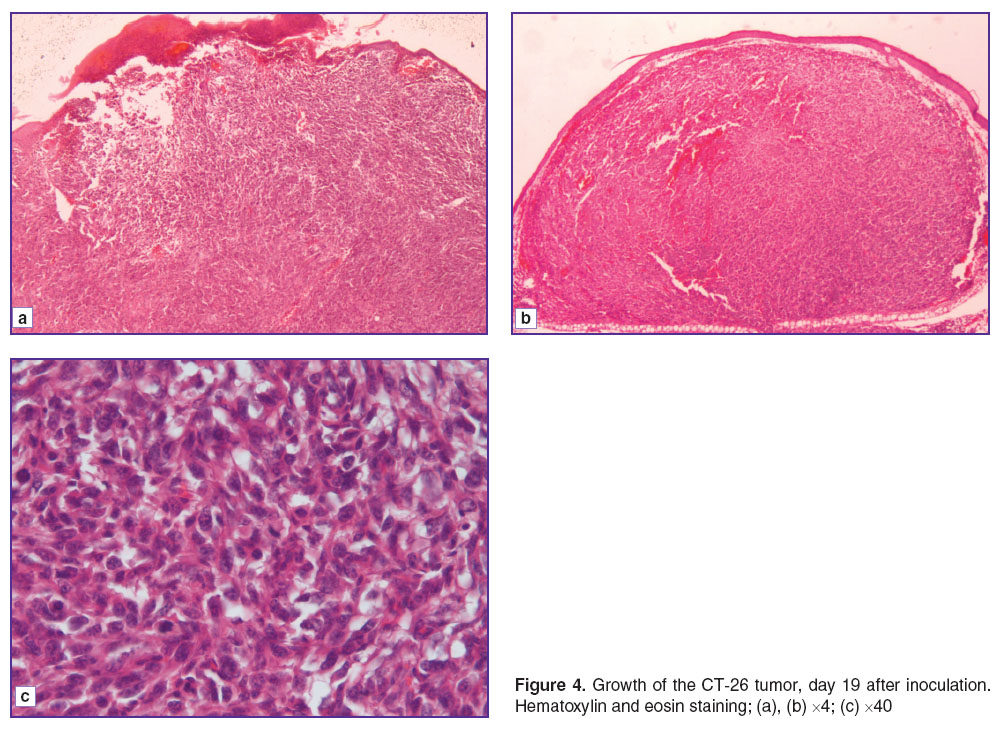 Figure 4. Growth of the CT-26 tumor, day 19 after inoculation. Hematoxylin and eosin staining; (a), (b) ×4; (c) ×40 Figure 4. Growth of the CT-26 tumor, day 19 after inoculation. Hematoxylin and eosin staining; (a), (b) ×4; (c) ×40
|
The final stage of the study was the investigation of the tumor on days 20–22 after inoculation. Firstly, the tumors characterized by their large size, ranging from 21.8 to 24.5 mm3 while retaining the typical CT-26 structure. Mosaic foci of spontaneous necrosis could be easily seen close to the surface and at depth, accounting for 97% of the area. Tumor cells with nuclear changes and cytoplasm coagulation (15%) could be observed outside the necrosis. Furthermore, randomly located sinusoidal vessels and small arterioles with diameters ranging from 10 to 200 μm could be seen in the depths of carcinoma. The vascular component constituted 1.5±0.3% of the tumor area. The vessels were filled with blood, and some of them had erythrocyte blood clots, stasis and diapedesis of the red blood cells (Figure 5). At the same time, small areas of the tumor without regressive changes were still visible. The maximum number of mitoses per view field was 4.
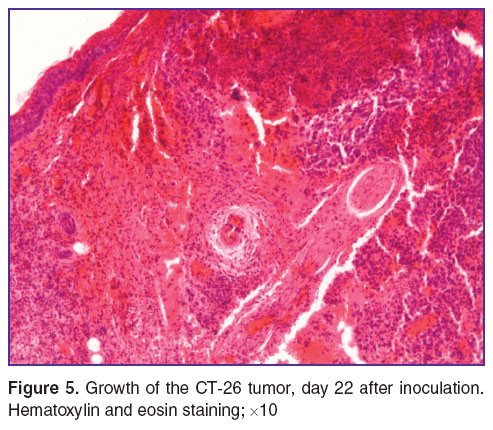 Figure 5. Growth of the CT-26 tumor, day 22 after inoculation. Hematoxylin and eosin staining; ×10 Figure 5. Growth of the CT-26 tumor, day 22 after inoculation. Hematoxylin and eosin staining; ×10
|
From the observed changes we conclude that the beginning of tumor cell death is a manifestation as spontaneous pathomorphism, however there is incomplete tumor regression and the presence of undamaged parts with proliferating cells and an extensive vascular component compared to the previous observations testify to continued tumor growth.
Thus, the study of the features of morphological changes in experimental CT-26 tumors growth showed that the development of the tumor is determined by not only by the mitotic activity of its cells, but also by the development degree of the vascular bed and its capacity to fulfill all its functions.
As can be seen from the results angiogenesis is not steadily increasing in the tumor, but is a fluctuating process, to a certain degree determined by the state of the tumor cells. The development of a vascular bed in the form of sinusoidal capillaries starts from 4 day after inoculation and then it increases until day 11. Tumors on days 17–19 exhibit a decrease in the proportion of vessels in the tumor tissue, which appears to indicate a deceleration in the formation of the vascular network, although the vasculature becomes more prominent again by days 20–22 with the appearance of not only sinusoidal capillaries, but also of larger vessels (up to 200 μm in diameter).
The manifestations of spontaneous regression of the tumours were characterized by the appearance of cells with irreversible damage to their nuclei and cytoplasm, simultaneous decrease in their mitotic activity and the appearance of mosaic foci of spontaneous necrosis. The observed hemodynamic and hemorheologic disorders — plethora (hyperemia), stasis, sludge-phenomenon and diapedetic hemorrhages — are the components of structural changes which also reflect the spontaneous regression. Here there is a correlation between the severity of the extent of spontaneous regression and the relationship between the tumor volume and the degree of the vascular bed development.
Manifestations of spontaneous regression of the tumor could be observed on day 11 after inoculation in the form of small diffusely located diapedetic hemorrhages and a small number of tumor cells with irreversible changes in their nuclei. The spontaneous tumour regress reached its maximum on days 20–22 when the foci of the tumor necrosis accounted for 97% of the tumor region.
Comparison of the data with angiogenesis indicators and the sizes of the tumors showed that, in the case of the small tumors with well-developed vascular networks observed on day 11, spontaneous regression was manifested only in the occurrence of irreversible cellular changes in a small percentage of tumor cells, whereas the larger tumors with limited vasculature (observed on days 17–19) were characterized by a considerably higher percentage of dying cells (85%). The larger tumors observed on days 20–22 after the inoculation were characterized by a high level of spontaneous regression despite their more developed blood vessels network. This leads us to conclude that there is an inadequate level of angiogenesis to meet the needs of the proliferating parenchymal cells.
There is no doubt that such developing spontaneous pathomorphosis could interfere with effective evaluation of the tumor response to the therapy, because it certainly contributes to the quantitative parameters reflecting the death of the structural neoplasm elements (the parenchyma and extracellular matrix).
Conclusion. Morphological and morphometric studies of the dynamics of inoculated CT-26 tumors growth show that the development of the carcinoma is characterized by two parallel processes: the formation of the tumor as a morphological substrate and the development of spontaneous regressive changes within it. The state of the tumor cells and the degree of spontaneous regressive changes development depend both on the size of the tumor and on the extent of development and functioning of the vascular network. For its part, angiogenesis is a process that depends on the state of the tumor cells, the increasing mass of which requires increased blood supply to the tumor. Our findings indicate that, when used for the evaluation of the effectiveness of anti-cancer treatments, CT-26 tumors inoculated into mouse ears should not be used for periods of longer than 11 days, due to the beginnings of evident manifestations of spontaneous pathomorphism of the tumor after this point.
Study Funding. This study was performed with financial support the Government of the Russian Federation (Agreement No.14.B25.31.0015).
Conflicts of Interest. The authors do not have any conflict of interest.
References
- Rosenberg D.W., Giardina C., Tanaka T. Mouse models for the study of colon carcinogenesis. Carcinogenesis 2009; 30(2): 183–196, http://dx.doi.org/10.1093/carcin/bgn267.
- Taketo M.M., Edelmann W. Mouse models of colon cancer. Gastroenterology 2009; 136(3): 780–798, http://dx.doi.org/10.1053/j.gastro.2008.12.049.
- Tanaka Y., Eda H., Tanaka T., Udagawa T., Ishikawa T., Horii I., Ishitsuka H., Kataoka T., Taguchi T. Experimental cancer cachexia induced by transplantable colon 26 adenocarcinoma in mice. Cancer Res 1990; 50(8): 2290–2295.
- Aulino P., Berardi E., Cardillo V.M., Rizzuto E., Perniconi B., Ramina C., Padula F., Spugnini E.P., Baldi A., Faiola F., Adamo S., Coletti D. Molecular, cellular and physiological characterization of the cancer cachexia-inducing C26 colon carcinoma in mouse. BMC Cancer 2010; 10: 363, http://dx.doi.org/10.1186/1471-2407-10-363.
- Chang Y.S., di Tomaso E., McDonald D.M., Jones R., Jain R.K., Munn L.L. Mosaic blood vessels in tumors: frequency of cancer cells in contact with flowing blood. Proc Natl Acad Sci USA 2000; 97(26): 14608–14613, http://dx.doi.org/10.1073/pnas.97.26.14608.
- Kruskal J.B. Can optical imaging assist in characterization of the onset of angiogenesis in developing hepatic metastases in mice livers? Radiology 2007; 243(2): 307–308, http://dx.doi.org/10.1148/radiol.2432061988.
- Knighton D., Ausprunk D., Tapper D., Folkman J. Avascular and vascular phases of tumour growth in the chick embryo. Br J Cancer 1977; 35(3): 347–356, http://dx.doi.org/10.1038/bjc.1977.49.
- Prikaz Minzdravsotsrazvitiya RF ot 23.08.2010 №708n “Ob utverzhdenii Pravil laboratornoy praktiki v Rossiiskoy Federatsii” [Ministry of Health and Social Development of the Russian Federation Decree No.708n as of Aug 23, 2010 “On good laboratory practices of the Russian Federation”].
- Mezhdunarodnye rekomendatsii (eticheskiy kodeks) po provedeniyu mediko-biologicheskikh issledovaniy s ispol’zovaniem zhivotnykh [International guiding principles (ethical code) for biomedical research involving animals]. 1985.
- Song H.-W., Lee S.-W., Jung M.-H., Kim K.R., Yang S., Park J.W., Jeong M.-S., Jung M.Y., Kim S. Optical monitoring of tumors in BALB/c nude mice using optical coherence tomography. Journal of the Optical Society of Korea 2013; 17(1): 91–66, http://dx.doi.org/10.3807/josk.2013.17.1.091.
- Avtandilov G.G. Meditsinskaya morfometriya [Medical morphometry]. Moscow: Meditsina; 1990.


