Prospective Value of Big Data Analysis Method for Assessment of Pharmacotherapy Quality and Efficacy in Patients with Arterial Hypertension
The aim of the study was to study the capabilities and perspectives of using big data analysis method to assess rationality and quality of pharmacotherapy in patients with arterial hypertension.
Materials and Methods. Analysis of data on supply of medicinal products (MP) to benefit-entitled categories of citizens (federal and regional) was carried out using the software written in Python 3.6 and OLAP-system. Pharmacoepidemiological methods were based on the defined daily dose (DDD) methodology.
Results. Rational pharmacotherapy and high adherence to treatment of arterial hypertension were not recorded in all cases. It was revealed that in the investigated areas of the Republic of Tatarstan, the average of 86 days passed from the initial to the subsequent visit and 25% of patients had the next appointment in 90 days or more in 2013. In addition to MPs for the cardiovascular system pertaining to category C of ATC classification (anatomic therapeutic chemical classification of drugs (the international system)), in 10% of cases, drugs of other categories were administered (acetylsalicylic acid, Piracetam, Cerebrolysin, etc.). Inhibitors of renin-angiotensin system were the most widely used MPs (196 DDD/person/year), while calcium channel antagonists came second in the volume of consumption (50.4 DDD/person/year). There were recorded significant differences in total consumption of antihypertensive MPs between areas (up to 3.5 times).
Conclusion. Big data analysis method is a promising tool to assess rationality and quality of pharmacotherapy providing the possibility to evaluate qualitative and quantitative indicators of pharmacotherapy at the general population level.
The World Health Organization describes the quality and safety of medical care as strategic priorities in global healthcare. Quality and safety assurance should become a high-priority issue for public healthcare systems.
Analysis of mortality causes in the RF population shows that circulatory system diseases (class IX, ICD-10) account for the highest proportion of deaths [1], the mortality rate for modifiable causes being 80% [2]. One of the predictors of mortality from heart disease is arterial hypertension (AH) also acknowledged by the WHO as the key factor contributing to high mortality rate in the society. The analysis of systolic and diastolic blood pressure for all countries over the period of 1975–2015 [3] has shown that AH is a worldwide problem. The incidence of arterial hypertension in 2015 was 24.1% in males and 20.1% in females. The number of adult patients suffering from hypertension increased from 594 million in 1975 to 1.13 billion in 2015.
Effective measures against AH are based on prevention of risk factors, lifestyle modification and effective pharmacotherapy. Unfortunately, these requirements are not always implemented in practice. Rationality and quality of pharmacotherapy still remain a key priority area for healthcare specialists.
Drawbacks of pharmacotherapy are a worldwide problem. According to the WHO data, more than half of medicinal products (MP) are administered without observing the necessary conditions. In clinical practice, physicians do not always use MPs with proven efficacy, optimal diagnosis and treatment methods. Therefore, additional years of life can be gained by improving the quality and efficacy of pharmacotherapy for chronic diseases, including AH [2].
One of the most important trends in present-day healthcare is widespread implementation of information systems, databases, means of information storage and transmission. In recent years, the big data analysis method has been considered to be a promising research tool [4]. It has advantages over the classic sampling methods due to the possibility to obtain more accurate and reliable information. The authors consider it appropriate to employ multivariate and structured information analysis using existing databases to retrieve pharmacoepidemiological evaluation data and assess the quality of pharmacotherapy in AH patients.
The aim of the study was to study the capabilities and perspectives of using big data analysis method to assess rationality and quality of pharmacotherapy in patients with arterial hypertension.
Materials and Methods. The object of study was the data on supply of medicinal products (MP) to benefit-entitled categories of citizens (federal and regional) in the Republic of Tatarstan. Based on the initial information, there was generated a database of medicines supplied to subsidized patients in three districts of the region during 2013–2015. To analyze the data and retrieve the summarized information, there was developed the software written in Python 3.6 language. Additionally, more than 20 other computer programs were developed. To obtain structured data suitable for analysis, the initial information presented as text string records was preprocessed based on the ETL approach (extract, transform, load). Primary data were cleared from unnecessary information, the MP names were retrieved, MPs were codified (ATC code), calculations of the total prescribed dose in milligrams and the number of prescribed defined daily doses (DDD) were performed. ETL approach was implemented using the software written in Python 3.6. Certain items of information were processed using programs in VB.NET. The file obtained at the output was in MS Excel format suitable for further analytical processing.
To calculate pharmacoepidemiological indicators and quality indicators, OLAP system, PowerPivot (Microsoft) and SPSS Statistics v. 22 (IBM) were used [5]. Pharmacoepidemiological methods were based on DDD methodology [6]. There was calculated the quantity of supplied DDDs, consumption volume per one district resident or patient suffering from arterial hypertension. Statistical analysis was performed based on calculation of statistical indices (mean, proportions, etc.).
Results. An important component of diagnostic and treatment process is pharmacotherapy consistency, i.e. the patient takes MPs systematically and continuously. However, treatment compliance is not absolute and some patients do not visit the doctor to obtain the next prescription for drugs. Compliance improvement has been shown to influence significantly AH outcomes [7].
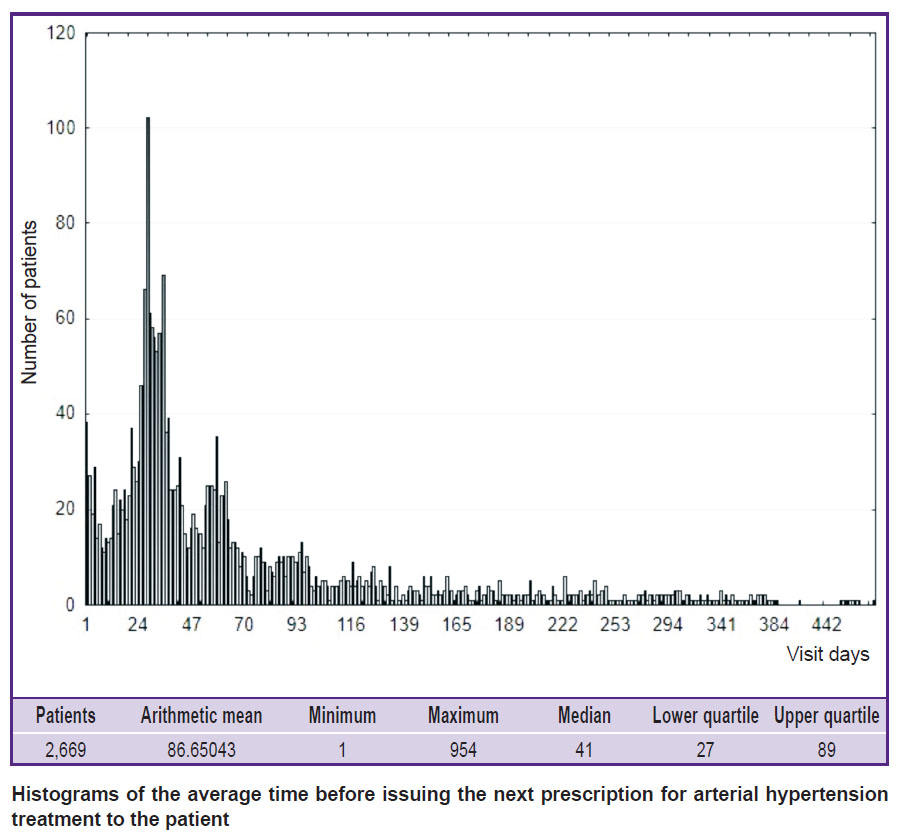
To understand the ways to assess compliance by database evaluation, there was performed process analysis based upon studying time intervals between visits. In particular, the time interval between zero and follow-up visits was estimated. This index reflects how much time passed before the patient had another appointment with a physician to obtain a prescription for MP. The results of this index evaluation are shown in the Figure as a histogram of distribution and the distribution statistics.
|
Histograms of the average time before issuing the next prescription for arterial hypertension treatment to the patient |
The obtained results speak of the following consistencies. On average, 86 days passed between the initial and follow-up visits. However, this index is difficult to interpret because the sample has no normal distribution. Fluctuations of this index range from 1 to 954, i.e. there were patients who came for antihypertensive drugs within 2 years. A more stable index for samples where distribution is different from normal is the median which is 41 days. These issues were discussed by us earlier in work [5]. Other important indices of “abnormal” samples are the values for upper (25%) and lower (75%) quartiles which equal 89 and 27 days in our study. This permits to conclude that in the studied areas, 25% of patients with hypertension had the next appointment with a physician after 90 days or more in 2013.
To find out how MP consumption correlates with the intervals between visits, we estimated the average number of prescribed DDDs of medications pertaining to category C of ATC classification. This index was 42.2 DDDs per one prescription. Comparing it with the median index (41 days), we can make a conclusion that, on average, about 50% of patients received MPs in the amount less than required until the next visit. This suggests that patients took no MPs for some time or bought medicines at their own expense.
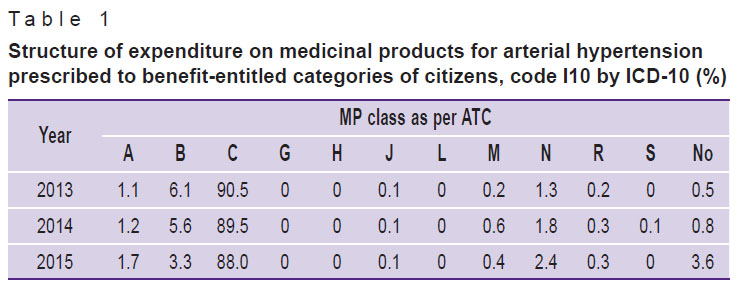
To assess the pharmacoeconomic determinants of MP use in patients with AH, we evaluated the structure of expenditure on MPs of different ATC classes (Table 1).
|
Table 1. Structure of expenditure on medicinal products for arterial hypertension prescribed to benefit-entitled categories of citizens, code I10 by ICD-10 (%) |
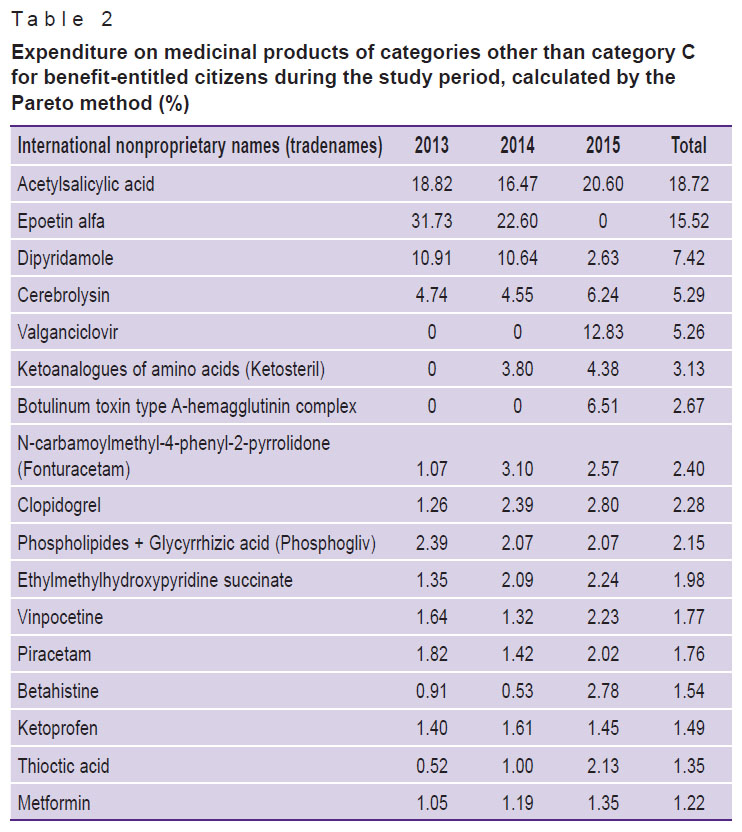
Data analysis shows that in addition to MPs of class C, drugs of other categories were prescribed in 10% of cases. To find out what other MP groups were prescribed additionally, expenditure structure was analyzed using the Pareto method (Table 2).
|
Table 2. Expenditure on medicinal products of categories other than category C for benefit-entitled citizens during the study period, calculated by the Pareto method (%) |
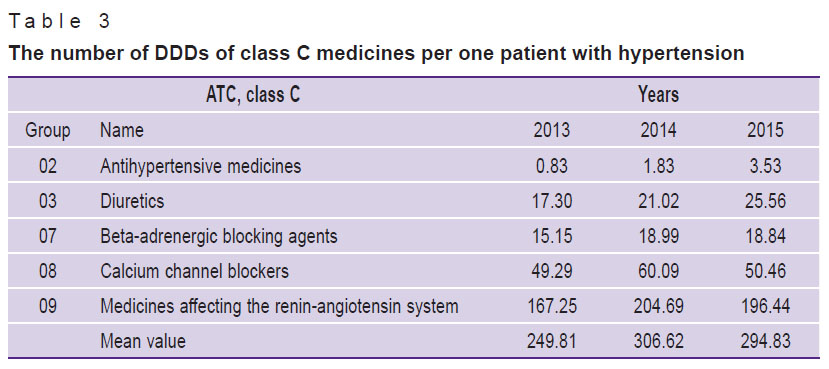
Acetylsalicylic acid was found to be the main MP prescribed for patients with AH. There are no indications to prescribe this medicine for hypertension, however, acetylsalicylic acid may be prescribed to patients with concomitant ischemic heart disease or liability to thrombosis. Such MPs as dipyridamole and clopidogrel can be used to treat concomitant ischemia. Piracetam and Cerebrolysin have no direct indications for treatment of hypertension, but they can be used to correct concomitant cognitive impairments. Epoetin Alfa cannot be considered as MP indicated for patients with hypertension either. To evaluate the use of antihypertensive MPs, we carried out pharmacoepidemiological analysis of consuming such medicinal products by patients with hypertension (Table 3).
|
Table 3. The number of DDDs of class C medicines per one patient with hypertension |
Consumption structure evaluation showed that inhibitors of the renin-angiotensin system are the most frequently used MPs, antagonists of calcium channels come second, diuretics occupy the third place and beta-blockers are the fourth. The average amount of consumption in DDDs increased by 18% during the study period and reached 294.8 DDDs/person/year.
Discussion. The facts evidence the presence of problems concerning prescription of MPs to benefit-entitled citizens in the country. Healthcare professionals should reconsider the practice of administration and rationalize prescription of subsidized medicines. Physicians have different priorities in administration of various MPs, which, in our opinion, speaks of existing stereotypes.
Currently, the amount of collected medical data is significant in the Russian Federation, including the Republic of Tatarstan. However, the extent of information analysis and understanding is insufficient. The present study has shown the possibility of using big data analysis for assessment of pharmacotherapy rationality and quality.
Databases are the key objects of present-day healthcare system. At the same time, only a few works are devoted to finding and using consistent patterns for the needs of practical healthcare in the Russian Federation. By themselves, data integration and accumulation do not affect the efficacy of disease prevention and treatment processes. In particular, introduction of electronic patient records in hospitals has resulted in improving data access speed and reducing the number of errors, but neither diagnostic process nor healthcare quality have been affected. Therefore, increase in diagnostic criteria number and informative value, as well as emergence of information systems to store and control information in healthcare, requires developing new approaches to medical data analysis. This problem is discussed in the works of foreign researchers showing the prospects of using databases as a tool for effective decision-making in healthcare management [8]. Capabilities and prospects of data analysis methods have been discussed in our previously published paper [9].
It has been shown that the results obtained by analyzing massive sources of information have less distortion and error.
Despite the widespread introduction of using DDDs in investigations, there is very little information on interpretation of the results in the literature. Usually researchers interpret the frequency of their prescribing as “high” and “low” [7, 10]. There are no standards defining which frequency is considered normal and which should be taken as deviation from norm and requiring correction. Federal standards restrict the average prescription frequency and cannot be used for these purposes.
The methodology of calculating DDDs makes it possible to find that the mathematical expectation of distribution (the arithmetic mean number of DDDs) in the study group of patients must be at least 365, if the patient takes MPs 365 days a year. However, the results of the present study show that this index is much lower in benefit-entitled group of AH patients under consideration. The histogram of patient distribution according to the number of DDDs taken shows that the highest number of patients have received less than 50 DDDs per year. On the one hand, this may indicate that patients bought part of MPs at their own expense. On the other hand, it can be assumed that patients did not take MPs and did not visit the doctor. Therefore, the index presented can be considered an indirect indicator of treatment compliance.
The results of the study allow us to review the existing knowledge about consistent patterns of MP consumption. It has been generally accepted that the system of DDDs is used for pharmacoepidemiological research. Supposedly, if consumption value is 20 DDD/1000 persons/day, it means that 2% of the population take this MP (i.e. receive continuous treatment) [7]. Therefore, in the population of patients who need MPs on a regular basis, the system gives the opportunity to evaluate how many times a year, on average, the patient received MPs. This index allows us to estimate the average number of days per year when one patient received treatment each day.
Thus, the present study provides the possibility to make a conclusion about the potential of using health information databases for the needs of pharmacoeconomics and pharmacoepidemiology. The results of the analysis show that there are reserves for improving rationality and quality of pharmacotherapy in cardiovascular diseases and it is necessary to develop regional programs for implementing improvement procedures.
Conclusion. Rational pharmacotherapy and high adherence to treatment of arterial hypertension are not registered in all cases. Big data analysis method is a promising tool to assess rationality and quality of pharmacotherapy providing the possibility to evaluate qualitative and quantitative indices of pharmacotherapy at the general population level.
Study Funding and Conflict of Interests. This study was not supported by any financial sources and the authors have no conflict of interests to disclose.
References
- Khabriev R.U., Lindendraten A.L., Komarov Yu.M. The strategy of health care of population as a background of public social policy. Problemy sotsial’noy gigieny, zdravookhraneniya i istorii meditsiny 2014; 3: 3–5.
- Golikova T.A. On elaboration and adoption of regional programs of healthcare modernization. Menedzhment kachestva v sfere zdravookhraneniya i sotsial’nogo razvitiya 2011; 1: 4–10.
- NCD Risk Factor Collaboration (NCD-
RisC ). Worldwide trends in blood pressure from 1975 to 2015: a pooled analysis of 1479 population-based measurement studies with 19·1 million participants. Lancet 2016; 389(10064): 37–55, https://doi.org/10.1016/s0140-6736(16)31919-5. - Loewen L., Roudsari A. Evidence for business intelligence in health care: a literature review. Stud Health Technol Inform 2017; 235: 579–583.
- Khafiz’yanova R.Kh., Burykin I.M., Aleeva G.N. Matematicheskaya statistika v eksperimental’noy i klinicheskoy farmakologii [Mathematical statistics in experimental and clinical pharmacology]. Kazan: Meditsina; 2006; 374 p.
- Ziganshina L.E., Magsumova D.R., Kuchaeva A.V., Pikuza O.I., Gerasimov V.B., Yavorskiy A.N. ATC/DDD classification system in pharmacoepidemiological studies. Kachestvennaya klinicheskaya praktika 2004; 1: 28–33.
- Russian Medical Society for Arterial Hypertension, Society of Cardiology of Russian Federation. Diagnosis and treatment of arterial hypertension. Kardiovaskulyarnaya terapiya i profilaktika 2008; 7(6 Suppl 2): 7–34.
- Nimmagadda S.L., Dreher H.V. On robust methodologies for managing public health care systems. Int J Environ Res Public Health 2014; 11(1): 1106–1140, https://doi.org/10.3390/ijerph110101106 .
- Khafiz’yanova R.Kh., Aleeva G.N., Burykin I.M. Perspektivy ispol’zovaniya data mining metodov analiza dannykh v meditsine. V kn.: Materialy Mezhdunarodnoy nauchno-prakticheskoy konferentsii “Rol’ nepravitel’stvennykh organizatsiy v reshenii problem, svyazannykh s razrabotkoy i vnedreniem innovatsionnykh tekhnologiy vo vsekh sferakh chelovecheskoy deyatel’nosti”, posvyashchennoy 15-letiyu obrazovaniya Akademii informatizatsii Respubliki Tatarstan (2 chast’) [Perspectives of using data mining methods to analyze medical data. In: Materials of International Scientific and Practical Conference “The role of non-governmental organizations in solving the problems of development and implementation of innovation technologies in all spheres of human activities” devoted to the fifteenth anniversary of the Academy of Informatization of Tatarstan Republic (part 2)]. Kazan; 2010; p. 32–39.
- Karmalita E.E., Yur’ev K.L. Consumption of medicinal agents for arterial hypertension management. Ukrainskiy meditsinskiy zhurnal 2007; 61(5): 63–72.
- Yakusheva E.N. Possibilities of using defined daily dose system. Vestnik Volgogradskogo gosudarstvennogo meditsinskogo universiteta 2008; 26(2): 74–77.