An Ensemble of Convolutional Neural Networks for the Use in Video Endoscopy
In this study, a technology for creating a classifier able to identify pathological formations in images obtained with video endoscopy using the methods of deep learning is proposed. For the training and testing of neural network models, images from the CVC-ColonDB open database and 20 colonoscopy video records from the University of Arizona (Phoenix, USA) were used. To improve the performance of the proposed classification model, noise effects inherent to video cameras were considered. In addition, a study on building the model using small data samples was conducted.
In building the classifier, we utilized the results of recent studies on convolutional neural networks used in medical diagnostics, which allows us to apply the proposed approach to designing the architecture of a convolutional neural network adapted to a given task. By generalizing the features of the successful models, we developed an approach towards creating a non-excessive convolutional neural network. According to the proposed approach, the network architecture is divided into blocks, which alternate to enable composing the most efficient architecture.
Using the proposed approach based on the recommended selection strategy and then ranking the most significant parameters, a second approach towards building an adaptive model of classifier has been proposed. It is based on the formation of an ensemble of classifiers such as the “convolutional neural network”. To ensure the stability of the model and its insensitivity to changes in the input data as well as its applicability to different classification tasks, a set of networks with different major parameters are incorporated into the ensemble.
Our experimental studies have shown that the proposed classifier can be improved by developing an ensemble of convolutional neural networks, which considers the functions proposed in the present approach. The results imply the prospective application of the developed approach for building classification models not only for medical diagnostics but also for general problems of machine vision based on small samples.
Introduction
For many sectors of the economy and scientific research, the video analytical approach has become an effective method of controlling the work, diagnosing dangerous situations, and detecting special objects or events; this approach involves the intellectual analysis based on machine learning [1, 2]. However, in medical applications, such innovations are limited to the detection of structural changes in organs and tissues, e.g., the size and color of tumors. Such an analysis can help in determining whether the detected changes have a clinical significance. This approach can be exemplified by the endoscopic data processing that provides visual information on the internal surfaces of the digestive tract [3, 4], as well as by the analysis of magnetic resonance images [5, 6].
In the field of endoscopy, the current research includes a video analysis of the digestive tract by utilizing an ensemble of classifiers that process and compare the results obtained from the areas of interest and the local binary patterns on different scales [7, 8]. The group of Li proposed the form descriptor from the MPEG-7 ART standard and also the improved Zernike moments that are not sensitive to image rotation, for the purpose of training a multilayer perceptron for the role of the pathology classifier [9]. In their further work, this group strengthened the classifier by including the characteristics of intensity, saturation, and tint, and comparing the results obtained from the updated selection of classifiers based on the multilayer perceptron and the support vector machine [10].
The similar type of research albeit aimed at solving the problems of rectal polyp localization is run by the group of Tajbakhsh who uses the methods of in-depth training [11]. They employ the “random forest” classifier to analyze the components of the discrete cosine transform of the area of interest. The group of Park [12] proposes using the segmentation algorithms by searching for active loops. The above approaches imply that the areas visually similar to rounded objects are extracted from the individual images of the video stream.
The second type of research involves the projects based on machine learning to analyze MR images of various organs. For example, for breast cancer diagnosis, various instruments (ultrasound, MRI, CT, and PET) extract the characteristics of abnormal areas: the size of the suspected area, the presence of calcifications, asymmetry, or an increased absorption of a radiopharmaceutical marker (for PET) [13]. Further, the characteristics obtained with the help of each technology were analyzed by the random forest algorithm; then the results of the ROS image analysis were compared separately for each imaging modality. When searching for brain tumors, the main components of the wavelet coefficients of the discrete wavelet transformation of the segmented MRI image and the multilayer perceptron (used as a classifier) were used [14]. In a study on the localization of prostate cancer [15], a three-dimensional convolutional neural network (CNN) was employed; there the input data included diffusion-weighted maps, maps of the external diffusion coefficient and dynamic contrast MRI cards. The above review illustrates that substantially different approaches to the creation of specific features and classifiers for the analysis of visual data were proposed.
In the current medical practice, endoscopy is the primary and most available diagnostic approach for internal tissue visualization. This procedure is used daily by many medical specialists to identify various abnormalities and make a fairly accurate diagnosis. The method involves a visual examination of the internal tissues of a person by using a special instrument equipped with a miniature camera. During the examination, a video clip is recorded [16]. To improve the quality of a diagnosis, and to reduce the number of diagnostic errors, the specialists identify the areas different from the normal standards; such an approach is essential for diagnosing and determining the health status of patients [17–19].
The aim of the study was to develop an approach to creating a model for classification of pathological formations based on video endoscopy data using convolutional neural networks. The model was expected to have high generalizing abilities, as well as insensitivity to a variety of visual effects caused by either the camera itself or by the process of data collection.
Classifier-building technology
The deep learning technology, in particular, the algorithms for setting and using CNN, is currently one of the most advanced tools for classifying visual images [20]. The advantages of this technology include the learning ability, adaptability, intuitive understanding of the working principles, and the universality in solving the tasks of image analysis.
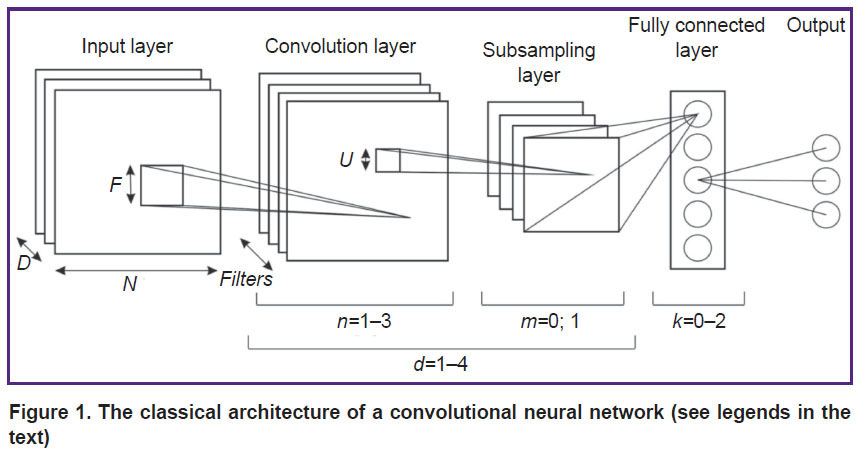
Within the classical approach, the CNN architecture (Figure 1) is described by the following parameters:
N is the dimension of the plane in the layer; for the input layer, the plane is the product of the height H and the width W of the image;
D is the depth of the input layer; in our case — the number of color channels in the image;
P is the number of rows and columns added to the boundaries of the layer that precedes the convolution layer, and filled with zeros;
S is the offset between the filters where neuron signals are generated in the convolution and subsampling layers;
F is the size of the square filters of the convolution layer;
Filters are the depth of the convolution layer (the number of filters);
U is the size of the square window in the merger layer;
Subf is the type of function that describes the subsampling layer (max — maximum or avg — average estimate);
K is the number of neurons in the fully connected layer;
C is the number of classes in the task; the classifier determines which class it belongs to (in our classification C=2, i.e., polyp/no polyp);
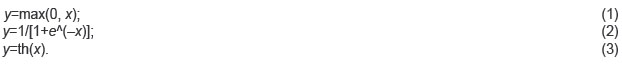
AF is the neuron activation function: the threshold function (1), the sigmoid function (2) or the hyperbolic tangent function (3):
|
Figure 1. The classical architecture of a convolutional neural network (see legends in the text) |
The network level is a sequence of a convolution layer and a subsampling layer. To find the solution for the applied tasks of classification of two-dimensional images, different versions of the double-level CNN are often used.
The recent results provide the following values of the parameters that are essential to obtain non-redundant high-quality models: the number of convolution layers in the level — n∈[1; 3], the number of subsampling layers in the level — m∈[0; 1], the number of levels — d∈[1; 4], and the number of fully connected layers in the network — k∈[0; 2] [21].
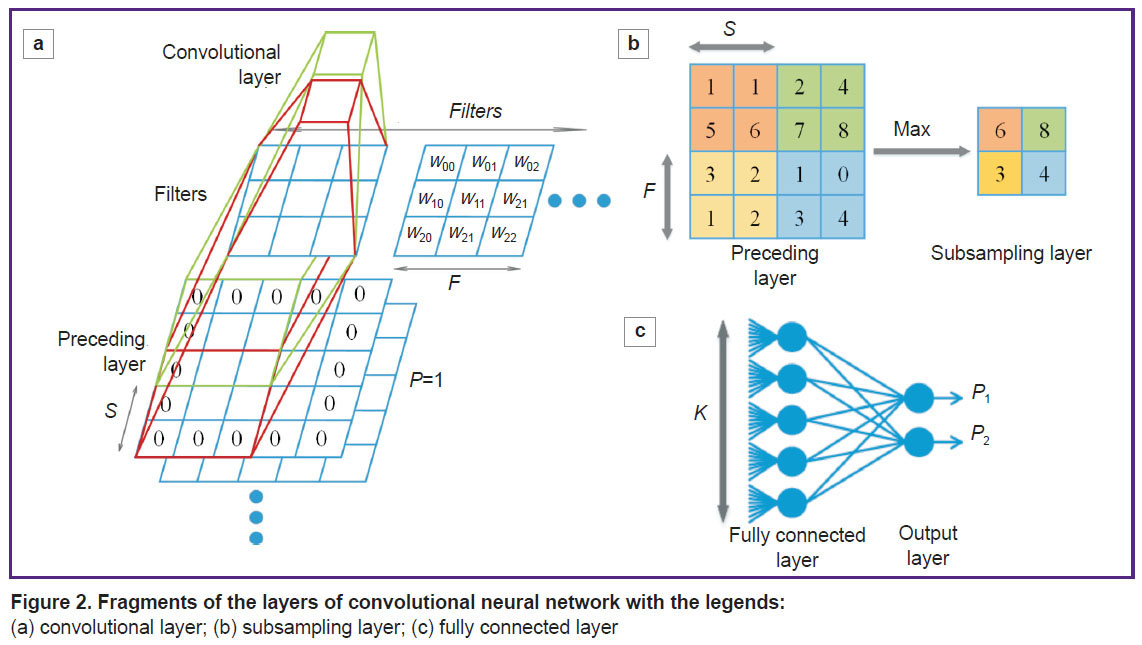
In Figure 2, we present the legends for the network parameters pertained to fragments of the convolution layer, the subsampling layer, and the fully connected CNN layer.
|
Figure 2. Fragments of the layers of (a) convolutional layer; (b) subsampling layer; (c) fully connected layer |
Nevertheless, the procedure of building a classifier capable of using the above algorithms is not yet formalized. To solve most of the classification tasks with the help of the CNN, fairly simple approaches have been used [21–23]:
1. A random selection of network configurations. Setting random architecture parameters and check the configuration quality of each model by using a specific data set. This method is the most inefficient and least likely used to solve the applied problems.
2. An expert approach. Using the network architecture that showed acceptable results in the similar tasks. In this way, most researchers use a CNN as a model of classification.
3. Automated selection of parameters with optimization. Selecting the network parameters by using optimization algorithms, for example, Bayesian. The approach is rarely used due to the high up-front costs of its implementation.
4. Empirical building an original CNN architecture to solve a certain class of problems. This approach is taken by researchers in the field of machine learning and designing of CNN models.
As noted above, the second approach is the most common, but there, one model applied to different tasks may have different efficiencies.
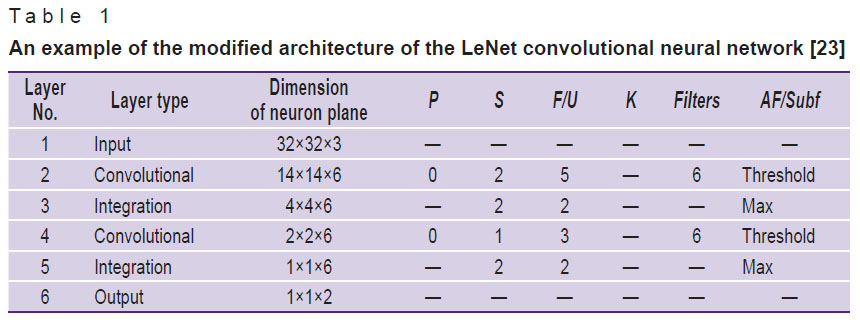
In this article, the performance of various classification models based on CNN is evaluated (see below) using one of the architectures presented in [23]. An example of this architecture is shown in Table 1.
|
Table 1. An example of the modified architecture of the LeNet convolutional neural network [23] |
Creating an efficient architecture of a convolutional neural network (CNN with an efficient architecture)
The task of building a CNN architecture can be represented by “reducing” the sizes of the input image to three-dimensional layers sized at 2×2 or 1×1 so to obtain the output signals indicating the probability that the input image is related to one of the existing classes. According to our approach, the network architecture is divided into several blocks with certain values of the parameters; alternating these blocks allows us to form the most effective architecture of the CNN.
As in the case of multilayer neural networks of direct propagation, when designing the CNN architecture, increasing the number of layers and internal connections makes it possible to build more complex models that allow one to analyze more complex images. In this case, we propose an approach to the procedure for automatically building the efficient network architecture, while taking into account the dimensions of the input vector and the requirements to the classifier quality.
1. Creating the parameters of the network input layer. In the task of image classification, there is a requirement of bringing the original image to the figure with height and width equal to N, while N must be dividable by 2 up to single digits. Typically, in the image classification problems, the input layer has a depth parameter D that is equal to the number of color channels of the image.
2. Creating the parameter values for the convolutional network layer.
If the preceding layer is not a convolutional one, the values of P and S are chosen so that the size of the convolution layer is equal to the size of the preceding layer according to formulas (4) and (5) used to calculate the width W and height H of the convolution layer, based on the sizes of the preceding layer Wp, Hp:

Exceptions:
If N≤2, the value of P=1 or P=3.
If the preceding layer is a convolutional one, then P is equal to zero or to the positive number closest to zero, in order to make the dimensions of the convolution layer be integers according to (4) and (5).
S=1, if F≥5, or a value close to 1, but the size of the convolutional layer must be an integer according to formulas (4) and (5).
F=5 or F=7 for large sizes of the preceding layer (N≥64) of the first convolutional layer of the network. When N≤32 for the first convolutional network layer — F=5 or F=3, the latter is usually more efficient.
The number of filters (Filters) depends on the dimension of the preceding layer, the depth of the current convolution layer, and the selected value of F. Following the recommendations for selecting the value of F, the number of filters increases with the depth of the convolution layers from 16 to 96 when using the filters recommended by others [6]. In this case, there should be an even number of filters, which is dividable by 2 up to single digits [20].
3. To select the function that activates the neurons in a convolutional layer, the threshold function is the best option.
4. Selecting the values for the subsampling layer parameters:
U=2, S=U, Subf=max. For N≤1, the subsampling layer is not used.
5. The decision to create a new convolutional layer is based on the following: if N≥3, another convolutional layer is created — you go to point 2; otherwise, you go to the subsequent point.
6. For a fully connected network layer, the condition of K=C should be set and the sigmoid activation function applied.
If the network performance is not good enough then its architecture can be sophisticated using the following rules:
a convolutional layer is added to one of the network levels, beginning with the last and deepest one;
the number of filters is increased (by 10–25% of the baseline figure), starting from the last and deepest level;
a new level of the network is added.
An example of a CNN with an effective architecture, created using the proposed approach, is presented in Table 2.

|
Table 2. An example of the proposed efficient architecture of the convolutional neural network built for solving the tasks associated with video analysis of medical data |
The use of this architecture in solving the tasks of medical image classification is exemplified in the experimentation section and compared with the LeNet [23] architecture (see Table 1). The present approach takes into account the earlier experience of developing successful configurations and allows one to enter the verified values of the network parameters in reference to the input data.
Creating an adaptive ensemble of convolutional neural networks
Based on reports [18, 21–23] on machine learning and the use of different CNN configurations, we identified the parameters having a significant impact on the classification results. Below is a list of these parameters ranked by their impact on the accuracy of classification.
The most important parameters are:
1) the size of filter F determines the efficiency of the feature selection in the image and the number of stored network parameters; it, therefore, is one of the most significant characteristics of the architecture;
2) the global network characteristic (the network level configuration) is determined by the types of layers it is comprised of. The study considers three types of levels: a level consisting of consecutive convolutional layers and a subsampling layer; a truncated level consisting of a convolutional layer only; and an extended level consisting of consecutively arranged two convolutional layers and one layer of subsampling.
Less significant parameters:
1) the number of filters (Filters) used in the convolutional layer of the network; it determines the variety of features that can be selected but is also able to facilitate rapid retraining of the network. This parameter is important, but the range of its possible values can significantly restrict the other parameters;
2) the number of levels or the depth of the network is largely determined by other network parameters but has a significant impact on the accuracy of classification of complex images. Complicating the architecture and adding a new level to the network can improve the resulting quality.
The other characteristics of the network layers are either strictly specific, such as the parameters of the subsampling layer, or auxiliary that have a limited effect on the results [24–30].
The new approach to the creation of an effective architecture of CNN, which is based on recommendations on choosing the values of network parameters and ranking the most significant of them, allows us to propose a more sophisticated approach to building an adaptive CNN based classifier. This approach involves the creation of an ensemble of CNN classifiers. In this, in order to provide insensitivity to changes in the initial data and applicability to solving various classification problems, the ensemble incorporates a set of networks where the most significant factors differ from each other. Moreover, each network is created by using such parameter values that the selected architectures are located at the most distant points of the parameters space, as proposed by our approach to the creation of an individual effective architecture.
The formation of CNN architectures for the ensemble is based on selecting the significant network parameters that differ from each other (the size of convolutional layer filters, the network level configuration). This includes defining the architectures of the CNN for the ensemble:
with different values of parameter F of the convolutional network layer according to the proposed approach;
with different network levels (extended, full and truncated).
Based on the obtained set of CNN, an ensemble of models is created; there, the final result is derived by averaging the results obtained from each model separately:

The proposed model of pathology classifiers is composed of an adaptive ensemble of CNN; their configurations are presented in Tables 3–5.

|
Table 3. The architecture of the first convolutional neural network included in the adaptive ensemble |
|
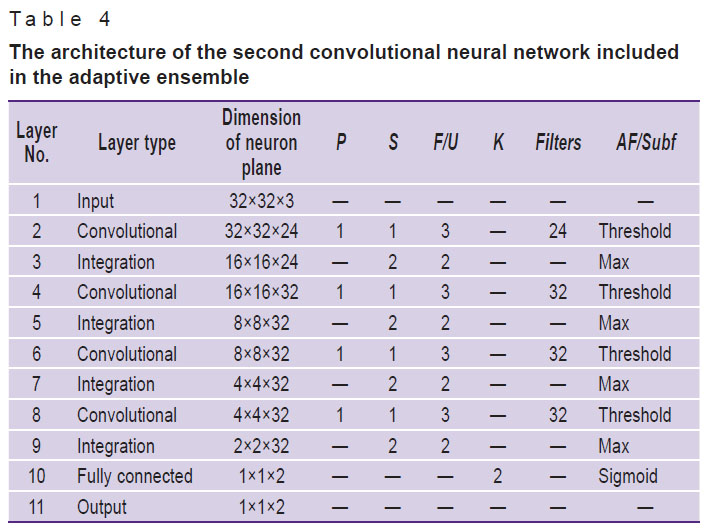
Table 4. The architecture of the second convolutional neural network included in the adaptive ensemble |
|
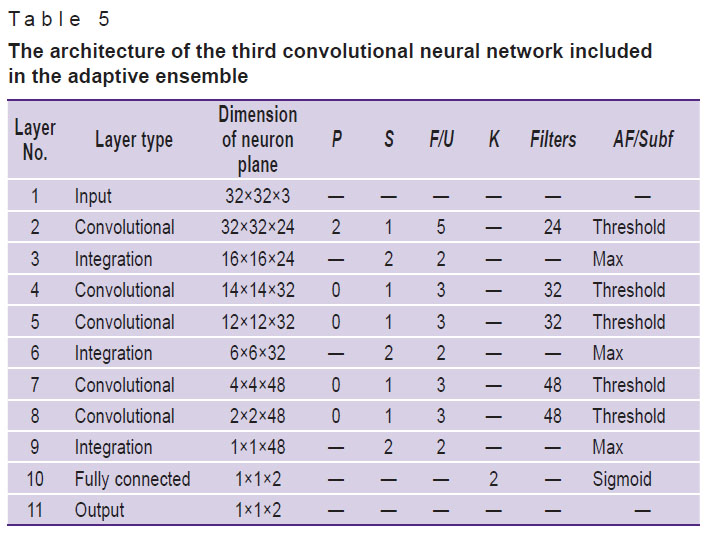
Table 5. The architecture of the third convolutional neural network included in the adaptive ensemble |
In the next section, the performance characteristics of the proposed architectures are presented; those are specifically adjusted to solving the problem of pathologies classification based on video-colonoscopy data. Below, the proposed model is analyzed in terms of its adaptability and resistance to changes in the input data.
Experimentation
To assess the performance of both an individual CNN with an effective architecture and an adaptive CNN ensemble, and compare their capabilities with the existing and actively used model based on the modified LeNet architecture [23], we have solved the task of building a classifier from video colonoscopy data. In the procedure of colonoscopy, a visual analysis of the internal surface of the colon is used to localize polyps (abnormal formations over the mucous membrane), take a biopsy and remove lesions.
Figure 3 shows video of colon segments containing polyps as well as segments of normal colonic mucosa. The latter look similar to neoplasms (such objects include benign anatomical variations, fecal masses, light spots etc).

|
Figure 3. Images of the rectum obtained by video-colonoscopy: (a) rectal polyps; (b) minor structures and artifacts in the normal rectum |
In a comparative study of images obtained with different endoscopes in different patients, the quality of the obtained images greatly varied. Specifically, the following characteristics of the endoscope may affect the quality: optical angle, resolution, focal length, the degree of illumination, and the type of light source [11]. Among other factors, there are patient-specific features, like the colon walls color, the vascular pattern, pre-examination preparation by the patient (the presence of fecal remains, their color and quantity). In addition, the analysis may be affected by defocusing, underexposure or overexposure of some areas, the presence of fluid on the optical lens, glares on the colon walls and other instrument associated events [20].
To obtain the models of individual and assembled networks that have a greater capability of generalization, about 40% of the samples selected for training and testing have been modified to simulate image deformations caused by optical effects. Underexposed and overexposed images have been simulated using histogram transformations, where the transformation function is determined adaptively from the original histogram of the image. In our case of discrete digital images, the brightness is represented by the so-called LUT brightness mapping table [24].
The processing of the image histograms via the brightness mapping table is carried out using the transformation:

where Im[i, j] is the intensity of an image pixel with the coordinates i, j, and the LUT is a whole number array of 256 elements for the 8-bit image or 65,536 elements for the 16-bit image obtained by the adaptive LUT.
Underexposure occurs when the image histogram is smoothed in the area of bright colors (“lights”). Overexposure, on the contrary, occurs in the area of dark colors (“shadows”).
Figure 4 shows examples of converting the original image into underexposed and overexposed versions, as well as the histogram of the pixel intensity distribution in such cases.

|
Figure 4. Examples of converting the original image (a) to underexposed (b) and overexposed (c) images |
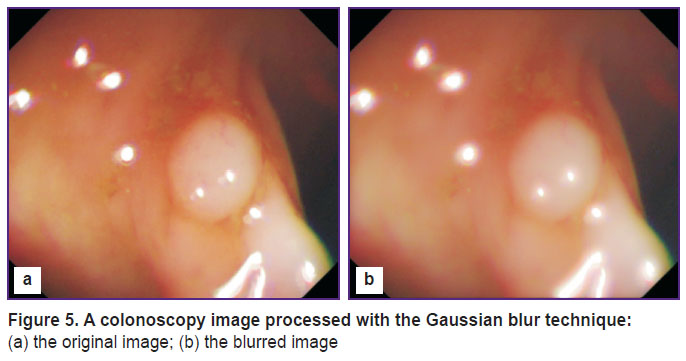
To simulate the camera lens contaminated with fluids, the Gaussian blur technique is used (Figure 5).
|
Figure 5. A colonoscopy image processed with the Gaussian blur technique: (a) the original image; (b) the blurred image |
A set of data derived from the CVC-ColonDB database [25] and 20 short video records of colonoscopy from University of Arizona (Phoenix, USA) were used to test the proposed approach aimed at creating a CNN with an effective architecture and an adaptive ensemble of CNN.
The study compared the results of training and testing identical samples with the use of three different classifiers: the modified LeNet architecture [23], the CNN with an effective architecture, and the adaptive ensemble of CNN proposed in this study; the characteristics of these three classifiers are presented in Tables 1, 2, and 3–5, respectively. The evaluation of the sensitivity and specificity for each model allowed us to rank them by the quality of the provided solutions and draw conclusions on the prospects of using these algorithms in practice.
The entire set of data under study included 7470 images of 3735 polyps and 3735 images of minor structures of the human rectum. In addition, a test set of 830 images was also used; of those, 415 were video-records of polyps and 415 — of minor intestinal structures. This test sample was aimed to evaluate the generalizing abilities of the models. We used images made in the RGB format of 32×32 pixels.
In our experiments, the initial data set was divided into subsets of randomly generated training samples; those included either 100 or 1000 images of polyps (half of the samples) or pathology-free colon (the other half). These subsets were needed to test the changes in the classifier performance caused (if any) by changes in the volume of the training sample, and also determine the stability of the created architectures by testing the networks trained with subsets of the major test sample of 830 images.
Testing the individual convolutional neural networks
Figure 6 shows the ROS curves based on the modified LeNet classifiers and the proposed CNN with an efficient architecture using the test-set of 830 samples; the subsets of training samples of 100 or 1000 images and the complete training set of 7470 images were used for training.

|
Figure 6. ROS curves reflecting the changes in the classification accuracy with changes in the training sample size for the modified LeNet and for the proposed convolutional neural network (CNN) with an efficient architecture The value in parentheses near the model name denotes the number of training samples |
When the networks trained with a sample of 100 images were compared for their performance, the architecture proposed in the present study showed a significantly higher quality. However, as the training sample size increased, the quality of image recognition became comparable; upon further increase in the training sample size, the proposed classifier obviously became more accurate as compared with the modified LeNet architecture. The results show that the CNN with an efficient architecture works better with large training samples, but it is sensitive to changes in the initial data.
Testing the ensemble and individual convolutional neural networks
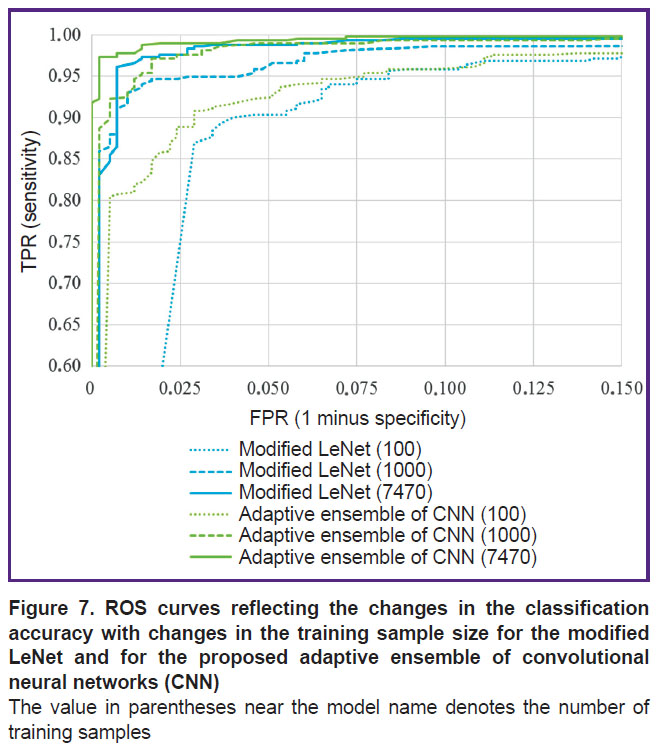
Figure 7 demonstrates the ROS curves resulted from testing the classifiers based on either the modified LeNet architecture or the adaptive CNN ensemble proposed in this study using the test set of 830 samples; the subsets of training samples of 100 or 1000 images and the complete training set of 7470 images were used for training.
|
Figure 7. ROS curves reflecting the changes in the classification accuracy with changes in the training sample size for the modified LeNet and for the proposed adaptive ensemble of convolutional neural networks (CNN) The value in parentheses near the model name denotes the number of training samples |
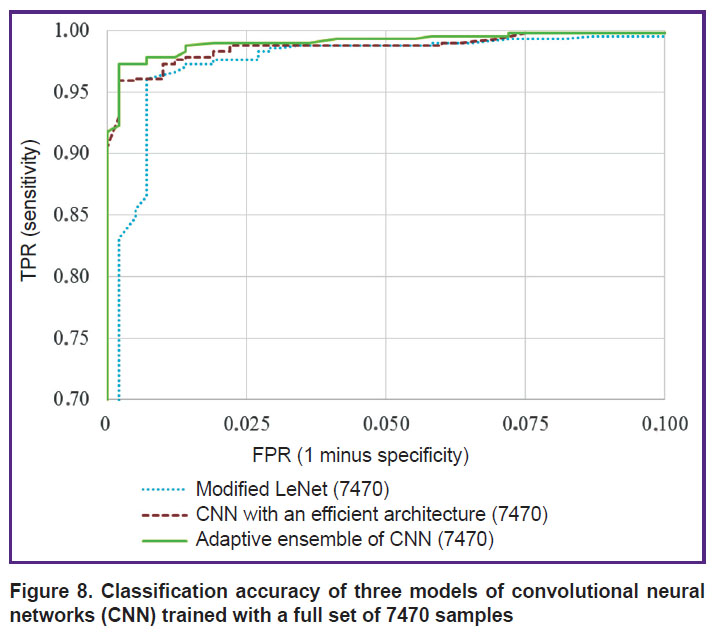
According to the presented results, the accuracy of classification performed by our CNN ensemble is superior to that achieved with the modified LeNet architecture at any set of training samples. When all three models trained with the full set of 7470 samples are compared, then the ensemble provides the highest classification accuracy in comparison with any model of individual neural network — both the modified LeNet and the CNN with an efficient architecture (Figure 8).
|
Figure 8. Classification accuracy of three models of convolutional neural networks (CNN) trained with a full set of 7470 samples |
Thus, the present experimentation provides good evidence in favor of the proposed approaches towards building reliable image classifiers for both individual neural networks and an ensemble of networks. The results rationalize the use of the proposed models even with a small sample of images.
Conclusion
The technology of the proposed classifiers of pathological formations is based on the analysis of CNN architectures that proved their efficiency in solving practical problems of medical diagnostics. By analyzing and generalizing the architectures of the successful models, we have developed an approach towards creating a non-excessive convolutional neural network. This network with an efficient architecture allows us to solve the problems of image classification related to pathological formations identified with video-colonoscopy. The additional studies have shown that it is possible to improve the quality of classification by applying an ensemble of convolutional neural networks, taking into account the functions described in the developed approach. Our experiments demonstrate a high-quality performance of the ensemble, even with small samples.
Financial support. The research was conducted within the framework of the program for increasing the competitiveness of the National Research Tomsk State University and was supported by Russian Foundation for Basic Research (grant No.16-47-700289).
Conflict of interest. The authors declare the absence of a conflict of interest.
References
- Varol G. Salah A.A. Efficient large-scale action recognition in videos using extreme learning machines. Expert Syst Appl 2015; 42(21): 8274–8282, https://doi.org/10.1016/j.eswa.2015.06.013.
- Taylor F.R. Evaluation of supervised machine learning for classifying video traffic. Doctoral dissertation. Nova Southeastern University; 2016.
- Li B., Meng M.Q.-H., Lau J.Y.W. Computer-aided small bowel tumor detection for capsule endoscopy. Artif Intell Med 2011; 52(1): 11–16, https://doi.org/10.1016/j.artmed.2011.01.003.
- Wang Y., Tavanapong W., Wong J., Oh J., de Groen P.C. Part-based multiderivative edge cross-sectional profiles for polyp detection in colonoscopy. IEEE J Biomed Health Inform 2014; 18(4): 1379–1389, https://doi.org/10.1109/jbhi.2013.2285230.
- Moon W.K., Shen Y.W., Bae M.S., Huang C.S., Chen J.H., Chang R.F. Computer-aided tumor detection based on multi-scale blob detection algorithm in automated breast ultrasound images. IEEE Trans Med Imaging 2013; 32(7): 1191–1200, https://doi.org/10.1109/tmi.2012.2230403.
- Sudharani K., Sarma T.C., Prasad K.S. Advanced morphological technique for automatic brain tumor detection and evaluation of statistical parameters. Procedia Technology 2016; 24: 1374–1387, https://doi.org/10.1016/j.protcy.2016.05.153.
- Goel R.M., Patel K.V., Borrow D., Anderson S. Video capsule endoscopy for the investigation of the small bowel: primary care diagnostic technology update. Br J Gen Pract 2014; 64(620): 154–156, https://doi.org/10.3399/bjgp14x677680.
- Silva F.B., Dinis-Ribeiro M., Vieth M., Rabenstein T., Goda K., Kiesslich R., Haringsma J., Edebo A., Toth E., Soares J., Areia M., Lundell L., Marschall H.U. Endoscopic assessment and grading of Barrett’s esophagus using magnification endoscopy and narrow-band imaging: accuracy and interobserver agreement of different classification systems (with videos). Gastrointest Endosc 2011; 73(1): 7–14, https://doi.org/10.1016/j.gie.2010.09.023.
- Li B., Meng M.Q., Xu L. A comparative study of shape features for polyp detection in wireless capsule endoscopy images. Conf Proc IEEE Eng Med Biol Soc 2009, https://doi.org/10.1109/iembs.2009.5334875.
- Li B., Fan Y., Meng M.Q.-H., Qi L. Intestinal polyp recognition in capsule endoscopy images using color and shape features. International Conference on Robotics and Biomimetics (ROBIO) 2009, https://doi.org/10.1109/robio.2009.5420969.
- Tajbakhsh N., Gurudu S.R., Liang J. A classification-enhanced vote accumulation scheme for detecting colonic polyps. Lecture Notes in Computer Science 2013; p. 53–62, https://doi.org/10.1007/978-3-642-41083-3_7.
- Park S.Y., Sargent D., Spofford I., Vosburgh K.G., A-Rahim Y. A colon video analysis framework for polyp detection. IEEE Trans Biomed Eng 2012; 59(5): 1408–1418, https://doi.org/10.1109/TBME.2012.2188397.
- Song S.E., Seo B.K., Cho K.R., Woo O.H., Son G.S., Kim C., Cho S.B., Kwon S.S. Computer-aided detection (CAD) system for breast MRI in assessment of local tumor extent, nodal status, and multifocality of invasive breast cancers: preliminary study. Cancer Imaging 2015; 15(1): 1, https://doi.org/10.1186/s40644-015-0036-2.
- El-Dahshan El-S.A., Mohsen H.M., Revett K., Salem A.-B.M. Computer-aided diagnosis of human brain tumor through MRI: a survey and a new algorithm. Expert Syst Appl 2014; 41(11): 5526–5545, https://doi.org/10.1016/j.eswa.2014.01.021.
- Liu L., Tian Z., Zhang Z., Fei B. Computer-aided detection of prostate cancer with MRI: technology and applications. Acad Radiol 2016; 23(8): 1024–1046, https://doi.org/10.1016/j.acra.2016.03.010.
- State Scientific Center of Coloproctology of the Federal Health Service. Department of endoscopic surgery. How is a colonoscopy? URL: http://www.colonoscopy.ru/patient/procedure2.htm.
- Uglov A.S., Zamyatin A.V. Informatsionno-programmnyy kompleks dlya resheniya zadach personalizirovannoy meditsiny s primeneniem intellektual’nogo analiza dannykh. V kn.: Informatsionnye tekhnologii i matematicheskoe modelirovanie [Information and software complex for solving problems of personalized medicine with the use of data mining. In: Information technologies and mathematical modeling]. Tomsk; 2017; p. 126–134.
- Axyonov S., Zamyatin A., Liang J., Kostin K. Advanced pattern recognition and deep learning for colon polyp detection. In: Distributed computer and communication networks: control, computation, communications. Moscow; 2016; p. 27–34.
- Aksenov S.V., Kostin K.A., Jianming L., Zamyatin A.V. Ispol’zovanie metodov Deep Learning dlya detektirovaniya polipov pri kolonoskopii. V kn.: Informatsionnye tekhnologii i matematicheskoe modelirovanie [The use of Deep Learning methods for polyp detection during colonoscopy. In: Information technologies and mathematical modeling]. Tomsk; 2016; p. 75–79.
- Bernal J., Sánchez J., Vilariño F. Towards automatic polyp detection with a polyp appearance model. Pattern Recognition 2012; 45(9): 3166–3182, https://doi.org/10.1016/j.patcog.2012.03.002.
- Nibali A., He Z., Wollersheim D. Pulmonary nodule classification with deep residual networks. Int J Comput Assist Radiol Surg 2017; 12(10): 1799–1808, https://doi.org/10.1007/s11548-017-1605-6.
- Tajbakhsh N., Gurudu S.R., Liang J. Automatic polyp detection in colonoscopy videos using an ensemble of convolutional neural networks. IEEE 12th International Symposium on Biomedical Imaging (ISBI) 2015, https://doi.org/10.1109/isbi.2015.7163821.
- LeCun Y., Kavukcuoglu K., Farabet C. Convolutional networks and applications in vision. Proceedings of 2010 IEEE International Symposium on Circuits and Systems 2010, https://doi.org/10.1109/iscas.2010.5537907.
- Flach P. Mashinnoe obuchenie. Nauka i iskusstvo postroeniya algoritmov, kotorye izvlekayut znaniya iz dannykh [Machine learning: the art and science of algorithms that make sense of data]. Moscow: DMK Press; 2015.
- CVC colon DB. URL: http://mv.cvc.uab.es/projects/colon-qa/cvccolondb.
- Park S.Y., Sargent D., Spofford I., Vosburgh K.G., A-Rahim Y. A colon video analysis framework for polyp detection. IEEE Transactions on Biomedical Engineering 2012; 59(5): 1408–1418, https://doi.org/10.1109/tbme.2012.2188397.
- Tajbakhsh N., Gotway M.B., Liang J. Computer-aided pulmonary embolism detection using a novel vessel-aligned multi-planar image representation and convolutional neural networks. Medical Image Computing and Computer-Assisted Intervention 2015; p. 62–69, https://doi.org/10.1007/978-3-319-24571-3_8.
- Zhu R., Zhang R., Xue D. Lesion detection of endoscopy images based on convolutional neural network features. 8th International Congress on Image and Signal Processing (CISP) 2015, https://doi.org/10.1109/cisp.2015.7407907.
- Kooi T., Litjens G., van Ginneken B., Gubern-Mérida A., Sánchez C.I., Mann R., den Heeten A., Karssemeijer N. Large scale deep learning for computer aided detection of mammographic lesions. Med Image Anal 2017; 35: 303–312, https://doi.org/10.1016/j.media.2016.07.007.
- Tajbakhsh N., Gurudu S.R., Liang J. A comprehensive computer-aided polyp detection system for colonoscopy videos. Lecture Notes in Computer Science 2015; p. 327–338, https://doi.org/10.1007/978-3-319-19992-4_25.