Computer-Assisted Assay of Respiratory Sounds of Children Suffering from Bronchial Asthma
The aim of the investigation was to develop a computer processing technique of respiratory sounds and determine their spectral characteristics for bronchial asthma diagnosis.
Materials and Methods. The proposed method is based on analysis of fast Fourier transform (FFT) parameters of respiratory sound spectrum and their comparison in asthmatic children and healthy volunteers. The technique was applied to study respiratory sounds in 5 children with incomplete control of bronchial asthma, aged 10.9±2.1 years, and in 5 healthy schoolchildren (12.0±2.2 years). Respiratory sounds were recorded at three points: anterior thoracic surface, above trachea to the right, and inside oral cavity. A signal recorded by microphone Sony (ECM-77B) was amplified and digitalized using a Sound Blaster (Singapore). A recorded signal was computer processed. A computer-assisted assay was performed using software developed on the basis of a standard software package MATLAB.
Results. Breath sounds of patients with bronchial asthma are characterized by a specific wheezing presented as harmonic amplitude increase with frequency near to 400 Hz; wheezing period ranges from 80 to 250 ms. These peculiar properties of wheezing made it possible to suggest a computer processing method of respiratory sounds based on the analysis of approximation function for harmonic amplitude-frequency relationship. Approximation function was chosen as superposition of two functions: the first function characterizing natural attenuation of sounds with increasing frequency; the second one describing typical of asthmatic breathing pathological increase of harmonic amplitudes with frequency near to 400 Hz.
The program developed self-diagnoses wheezing typical for asthmatic children.
Conclusion. A computer-assisted assay of respiratory sounds can be the basic to an objective, independent of a doctor’s subjective opinions, automated computer-assisted diagnostic technique of respiratory sounds typical of bronchial asthma.
Respiratory obstruction (especially the obstruction of bronchial tubes) is the most important clinical characteristics of the bronchial asthma and some other respiratory diseases. The asthma diagnosis is based on clinical symptoms and identification of functional state of lungs that can be difficult to make in some cases of pediatric practice [1–4]. The computer analysis of respiratory sounds can be an additional diagnostic method of lung diseases including bronchial asthma in children. Respiratory sounds result from turbulent and laminar air flows in respiratory ways of different diameter. The characteristics of respiratory ways changed by various diseases lead to appearance of additional pathological sounds. For example, a specific wheezing is frequently revealed during the examination of patients with respiratory obstructive diseases such as asthma [5–8]. The classical auscultation has some noticeable disadvantages: subjective and variable interpretation of diagnostic information. The objectivity of auscultatory diagnosis can be significantly improved using digitalized sound signals and their computer processing [7].
Respiratory sounds accompanying broncho-obstructive syndrome can be characterized as a number of periodic waves, the basic frequency being in the range from 100 to 500 Hz. The researches [9, 10] showed that the basic frequency between 100 and 1000 Hz and between 400 and 1600 Hz, respectively. Moreover, wheezing has the dominant frequency — over 400 Hz, while in moist rales — about 200 Hz and lower [10, 11]. The breathing of asthmatic patients is characterized by wheezing sounds in expiratory phase, the duration of wheezing being in the range from 80 to 250 ms. The wheezing, which has the 1 frequency is called monophonic (monoharmonic), and wheezing with several frequencies — polyphonic.
In most studies for analysis there were chosen from 1 to 4 respiratory cycles divided into inspiratory and expiratory phases, the average duration of the record being from 3 to 20 s [6]. Respiratory sounds were recorded and studied by sound spectrography followed by the comparison with spirometry findings [7, 12–14].
The authors [15] suggested a new approach to study the spectrum of respiratory sounds: the sounds were recorded in an oral cavity of a child, and then they determined diagnostically reliably signs typical of obstructive changes in the form of wave fluctuations on a frequency of over 5000 Hz. N.A. Heppe et al. [16] offered a new computer program, which gives an opportunity to estimate the area under the curve, which shows respiratory sounds.
C. Habukawa et al. [17] recorded the respiratory sounds in two places (on thoracic surface and trachea) and analyzed the characteristics of acoustic transmission: chest wall sound index (CWI) and tracheal sound index (TRI), two-dimensional diagrams CWI and TRI, as well as introduced a new index — breath sound index (BSI). They noticed a significant difference of TRI and BSI values in children with asthma, and in healthy children (Pearson correlation coefficient p=0.007 and p<0.001 respectively). Moreover, a significant difference of CWI and TRI values in children with controlled and uncontrolled bronchial asthma was revealed. However, the values of these indexes for asthmatic patients and healthy people vary in wide ranges, which overlap to a great degree. For example, BSI and TRI can change in the range from –3 to 3 dB and from –20 to –6 dB for asthmatic patients, and from –3.8 to 0.5 dB and from –19 to –7 dB for healthy children, respectively. This makes the diagnostics using the indices difficult.
The appearance of hard-to-find in auscultation diagnostics high-frequency harmonics (>250 Hz) of respiratory sounds of children with asymptomatic asthma can be the evidence of small respiratory obstruction [12]. K. Kosasih [18] et al. represented the results of cough analysis respiratory sounds of children with respiratory diseases. The records of the sounds were used for the automatic determination of the cough type: productive or non-productive [19]. Various methods (frequency analysis, fast Fourier transform (FFT), spectrogram, and sonogram) were recommended to be used for the analysis of respiratory sounds and diagnostics of respiratory diseases [14]. Respiratory sounds of children with bronchial asthma were studied using wavelet-analysis [20, 21]. On obtained wavelet spectra it was noted changes of harmonic peaks in the zone of the null formant and sound wave in broncho-obstructive syndrome [22].
However, no numerical values, which enable to characterize the respiratory noise as a sound produced by a patient and which can be used to develop computer diagnostic techniques, were offered.
The aim of the investigation was to develop a computer processing technique of respiratory sounds based on fast Fourier transform parameters and determine their spectral characteristics for bronchial asthma diagnosis.
Materials and Methods. Our system for recording breathing sounds (Fig. 1) was developed according to the standards of “Computerized Respiratory Sound Analysis, CORSA” [13]. Analog processing unit consists of a sensor (microphone Sony (ECM 77B)), a prime amplifier, a pass-band filter (PBF) and an analog-to-digital converter (ADC). PBF and ADC are combined in the external sound card (Sound BLASTER, Singapore).
 Fig. 1. The scheme of the sound-recording system (a) and a photo of the main parts of the system (b): a microphone, an external sound card and a personal computer (PC) (from left to right) Fig. 1. The scheme of the sound-recording system (a) and a photo of the main parts of the system (b): a microphone, an external sound card and a personal computer (PC) (from left to right)
|
Some distortions in sound recording usually result from sensor contact pressure change occurring when a sensor is moved or/and a patient moves. Other types of low-frequent “parasitic noises” (unrelated to the respiratory system activity) are heart sounds, muscle sounds and external low-frequency sounds. The frequency of these sounds is lower than 100 Hz. The intensity of these interfering noises can be higher than that of the respiratory sounds. High-frequency sounds (with frequency >2500 Hz) also do not always show the activity of the lungs. To exclude low- and high-frequency sounds and prevent ADC overload, we determined PBF frequency band in the range of 100–2.5 kHz, with the components of respiratory sounds being maintained.
The amplifier is used to increase the amplitude of the recorded signal so that ADC is to be used in an optimal linear range. ADC enables to transform an analog signal into a digital one, sampling frequency being 96 kHz. Similar recording systems were used in many researches devoted to the study of breathing sounds [5–7, 9].
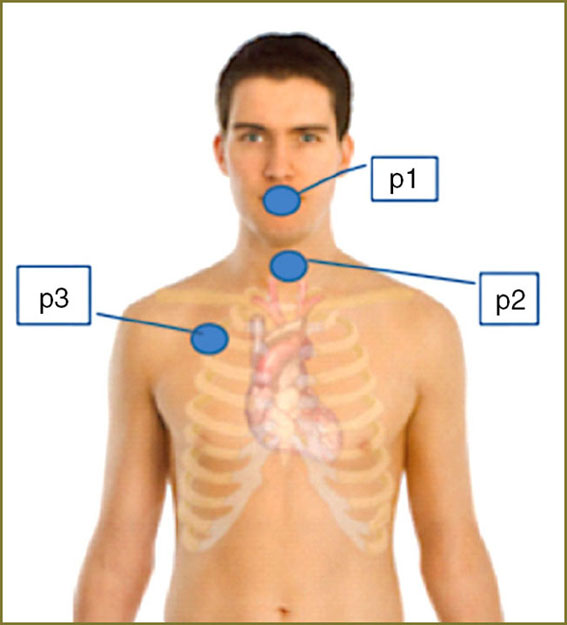
Respiratory sounds were recorded using Sony microphone (ECM-77B) at three points: in the oral cavity (point 1), above trachea (point 2), and above the right lung (point 3) (Fig. 2). In order to record breathing sounds during several respiratory cycles, they are to be recorded for about 25 s. This enabled to reduce the influence of casual variations of sound intensity on the results.
 Fig. 2. The points of the respiratory sound recording; point 1 (p1) — in the oral cavity; point 2 (p2) — above the trachea; point 3 (p3) — above the right lung Fig. 2. The points of the respiratory sound recording; point 1 (p1) — in the oral cavity; point 2 (p2) — above the trachea; point 3 (p3) — above the right lung
|
5 children with acute bronchial asthma with insufficient control of the disease, aged 10.9±2.1 years old and 5 healthy schoolchildren (12.0±2.2 years old) were involved in the study. The clinical examination of the patients and the record of respiratory sounds were made in Perm Children’s City Clinical Hospital No.3 (Russia). The study complies with the declaration of Helsinki (adopted in June, 1964 (Helsinki, Finland) and revised in October, 2000 (Edinburg, Scotland)), and was performed following approval by the ethic committee of Perm State Medical Academy named after E.A. Vagner. Written informed consent was obtained from parents of all examined children according to the federal act “The Basic Law on the Health Protection of the Citizens of the Russian Federation” dated July, 22, 1993, No.54871. Bronchial asthma was diagnosed in patients according to the recommendations represented in the National Program [1]. Auscultatory findings of patients with bronchial asthma were characterized by harsh respiration, the presence of diffusive wheezing above the both lungs. Healthy schoolchildren had vesicular breathing with good passage in all parts of the lungs.
Computer analysis of respiratory sounds using FFT was made at Ben-Gurion University of the Negev (Israel). The software used there was developed on the base of standardized software MATLAB package.
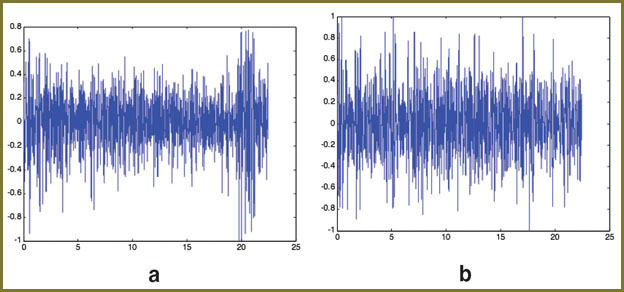
Results and Discussion. Fig. 3 shows a typical form of the recorded sound wave.
 Fig. 3. The normalized sound recorded at point 2 of a patient (a) and of a volunteer (b). In both cases the maximum level was taken equaled to unit Fig. 3. The normalized sound recorded at point 2 of a patient (a) and of a volunteer (b). In both cases the maximum level was taken equaled to unit
|
To develop an algorithm of computer diagnostics, we compared FFT spectra of patients and of volunteers (Fig. 4). The sound spectrum of patients at point 2 was characterized by a significant increase of harmonic amplitudes in frequency range near 400 Hz (Fig. 4, a), while in volunteers` spectrum only few separated harmonics with high amplitude were observed (Fig. 4, b). At the same time, we saw no such an increase of harmonic amplitude in sound spectrum recorded at other point of a patient e.g. point 3 (Fig. 4, c). One of the explanations of the fact can be as follows: the duration of wheezing is about 100 ms, and time intervals between the wheezing periods can be longer; in FFT spectrum of a long signal one cannot overlook the increase of harmonic amplitudes associated with asthma, compared to the background noise.
 Fig. 4. FFT spectra of sound signals recorded at point 2 of a patient (a) and a volunteer (b); and the sound signal spectrum recorded at point 3 of the patient (c) Fig. 4. FFT spectra of sound signals recorded at point 2 of a patient (a) and a volunteer (b); and the sound signal spectrum recorded at point 3 of the patient (c)
|
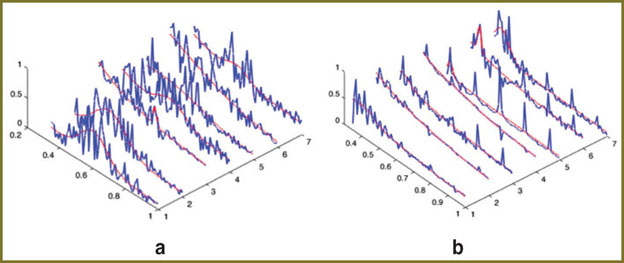
To improve the analysis accuracy we suggested considering time intervals, ~150 ms in duration, separately. To compare spectral characteristics in different time intervals they are represented by the following way (Fig. 5): the amplitudes of harmonics are normalized by the highest amplitude in the frequency range of interest — from 250 Hz to 750 Hz, the frequencies being normalized by 750 Hz. The presentation of normalized spectra in a structure enables to avoid the necessity of taking into account the natural variations of the breathing intensity.
 Fig. 5. FFT spectra for different time period ranges of respiratory sounds recorded at point 2 of a patient (a) and a volunteer (b). Red curves show the results of spectra fitting using Eq. (1) Fig. 5. FFT spectra for different time period ranges of respiratory sounds recorded at point 2 of a patient (a) and a volunteer (b). Red curves show the results of spectra fitting using Eq. (1)
|
Patients` spectra of respiratory sounds can be divided into two types: the first is characterized by the increase of harmonic amplitudes in the frequency range near 400 Hz (Fig. 5, a, ranges 1, 2, 5 and 7) and the second — with no increase (Fig. 5, a, ranges 3 and 6). The increase of harmonic amplitudes with frequency near 400 Hz was reported in many studies and was associated with wheezing specific for bronchial asthma [3, 8, 23]. In spectra of healthy volunteers there is no such amplitude increase (Fig. 5, b).
To characterize the increase of amplitude (wheezing), we suggested to fit the spectra of respiratory sounds by the following expression:

|
where Y — normalized harmonics` amplitude; x — normalized frequency; a, b, c and d characterize the maximum of wheezing intensity, its frequency band and frequency at which wheezing reaches its maximum.
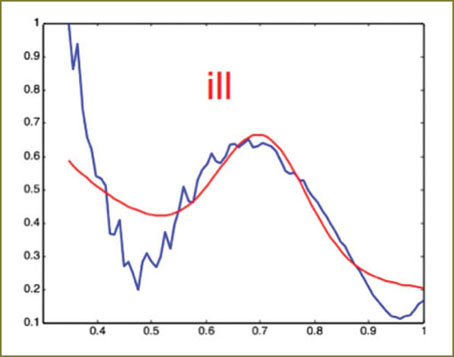
In Fig. 5 and 6 the results of spectra fitting are shown by red curves.
The first term (a/x) in the right part of Eq. (1) describes the decrease of harmonics` amplitude with a frequency for both the patients and the volunteers.
The performed analysis of spectra of respiratory sounds of patients and of volunteers shows the parameters c and d to be the most important for bronchial asthma diagnosis. Concurrent fulfillment of the conditions

gives the evidence of specific asthmatic wheezing. The similar procedure applied for the analysis of sound recorded at point 3 in patients also showed the presence of time ranges meeting conditions (2). However, the number of such time ranges during the recording time (about 30 s) depends heavily on a sensor’s location and can be much less than those at point 2. This fact confirms our above mentioned supposition that it can be difficult to distinguish the harmonic amplitudes specific for asthma from the spectrum of recorded respiratory sounds. In order to increase the sensitivity of the method proposed and its accuracy, we suggest selecting only those time ranges, which meet condition (2). Fig. 6 shows the results of such selection applied to signal from point 3.
It should be emphasized that in our study the analysis of spectra of respiratory sounds of healthy volunteers reveals none time interval meeting conditions (2) and being characteristic of wheezing specific for bronchial asthma. Thus, the offered criteria can be used for computer diagnosis and selection of the most suitable point to record respiratory sounds.
Conclusion. Respiratory sounds of patients with bronchial asthma are characterized by a specific wheezing presented as harmonic amplitude increase with frequency near 400 Hz; wheezing period ranges from 80 to 250 ms. These peculiar properties of wheezing in asthmatic patients made it possible to suggest a computer processing method of respiratory sounds that can be the basic of an objective, independent of a doctor’s subjective opinions, automated computer-assisted diagnostic technique of respiratory sounds typical of bronchial asthma.
Study Funding. The work was carried out within the framework of the project “IRG — International Research Group” and supported by the Perm Territory Government.
Conflict of Interests. The authors have no conflict of interest to declare.
References
- Chuchalin A.G., et al. Natsional’naya programma «Bronkhial’naya astma u detey. Strategiya lecheniya i profilaktika» [National program “Bronchial asthma in children. Treatment strategy and prevention”]. Moscow; 2012.
- Global initiative for asthma (GINA) 2012. Available from: www.ginasthma.org.
- Brand P.L.P., Baraldi E., Bisgaard H., Boner A.L., Castro-Rodriguez J.A., Custovic A., et al. Definition, assessment and treatment of wheezing disorders in preschool children: an evidence-based approach. Eur Respir J 2008; 32: 1096–1110, http://dx.doi.org/10.1183/09031936.00002108.
- Global strategy for the diagnosis and management of asthma in children 5 years and younger (GINA) 2009. Available from: www.ginasthma.org.
- Sovijärvi A.R.A., Vanderschoot J., Earis J.E. Standardization of computerized respiratory sound analysis. Eur Respir Rev 2000; 10: 77, 585.
- Reichert S., Gass R., Brandt C., Andres E. Analysis of respiratory sounds: state of the art. Clinical Medicine: Circulatory, Respiratory and Pulmonary Medicine 2008; 2: 45–58.
- Gavriely N. Breath sounds methodology. Boca Raton (FL): CRC Press; 1995; 203 p.
- Saeed S., Body R. Towards evidence based emergency medicine: best BETs from the Manchester Royal Infirmary. Auscultating to diagnose pneumonia. Emerg Med J 2007; 24: 294–296.
- Sovijärvi A.R.A., Malmberg L.P., Charbonneau G., Vanderschoot J., Dalmasso F., Sacco C., Rossi M., Earis J.R. Characteristics of breath sounds and adventitious respiratory sounds. Eur Respir Rev 2000; 10: 77, 591–596.
- Sovijärvi A.R.A., Dalmasso F., Vanderschoot J., Malmberg L.P., Righini G., Stoneman S.A.T. Definition of terms for applications of respiratory sounds. Eur Respir Rev 2000; 10: 77, 597–610.
- Bahoura M., Lu X. Separation of crackles from vesicular sounds using wavelet packet transform. Acoustics, Speech and Signal Processing ICASSP 2006; 2: 1076–1079, http://dx.doi.org/10.1109/ICASSP.2006.1660533.
- Habukawa C., Nagasaka Y., Murakami K., Takemura T. High-pitched breath sounds indicate airflow limitation in asymptomatic asthmatic children. Respirology 2009 Apr; 14(3): 399–403, http://dx.doi.org/10.1111/j.1440-1843.2008.01465.x.
- Gurung A., Scrafford C.G., Tielsch J.M., Levine O.S., Checkley W. Computerized lung sound analysis as diagnostic aid for the detection of abnormal lung sounds: a systematic review and meta-analysis. Respir Med 2011 Sep; 105(9): 1396–1403, http://dx.doi.org/10.1016/j.rmed.2011.05.007.
- Taplidou S.A., Hadjileontiadis L.J. Wheeze detection based on time-frequency analysis of breath sounds. Computers in Biology and Medicine 2007; 37: 1073–1083, http://dx.doi.org/10.1016/j.compbiomed.2006.09.007.
- Malyshev V.S., Ardashnikova S.I., Kaganov S.Yu., et al. Sposob registratsiistratsii dykhatel’nykh shumov [A recording method of respiratory sounds]. Patent RF №5062396. 1995.
- Geppe N.A., Malyshev V.S., Lisitsin M.N., Seliverstova V.A., et al. Bronkhofonografiya v kompleksnoy diagnostike bronkhial’noy astmy u detey [Bronchophonography in a complex diagnostics of bronchial asthma in children]. Pul’monologiya — Pulmonology 2002; 5: 33–39.
- Habukawa C., Murakami K., Horii N., Yamada M., Nagasaka Y. A new modality using breath sound analysis to evaluate the control level of asthma. Allergol Int 2013 Mar; 62(1): 29–35, http://dx.doi.org/10.2332/allergolint.12-OA-0428.
- Kosasih K., Abeyratne U.R., Swarnkar V. High frequency analysis of cough sounds in pediatric patients with respiratory diseases. Conf Proc IEEE Eng Med Biol Soc 2012; 2012: 5654–5657, http://dx.doi.org/10.1109/EMBC.2012.6347277.
- Swarnkar V., Abeyratne U.R., Chang A.B., Amrulloh Y.A., Setyati A., Triasih R. Automatic identification of wet and dry cough in pediatric patients with respiratory diseases. Ann Biomed Eng 2013 May; 41(5): 1016–1028, http://dx.doi.org/10.1007/s10439-013-0741-6.
- Koryukina I.P., Furman E.G., Abdullaev A.R., Nikiforova Yu.K. Sposob diagnostiki sindroma bronkhial’noy obstruktsii [A diagnostic technique of bronchial obstruction syndrome]. Patent RF №2301621. 1995.
- Taplidou S.A., Hadjileontiadis L.J., Kitsas I.K., Panoulas K.I., Penzel T., Gross V., Panas S.M. On applying continuous wavelet transform in wheeze analysis. Engineering in Medicine and Biology Society IEEE 2004; 2: 3832–3835, http://dx.doi.org/10.1109/IEMBS.2004.1404073.
- Furman E.G. Patterny veyvlet-spektrogramm zvukovogo signala dykhaniya v norme i pri bronkhial’noy astme u detey [Patterns of wavelet-spectrograms of audio respiratory signals in health and in bronchial asthma in children]. Vestnik ural’skoy akademicheskoy meditsinskoy nauki — Vestnik of Ural of Academic Medical Science 2006; 3: 96–99.
- Fenton T.R., Pasterkamp H., Tal A., Chernick V. Automated spectral characterization of wheezing in asthmatic children. IEEE Transactions on Biomedical Engineering 1985 Jan; 32(1): 50–55, http://dx.doi.org/10.1109/TBME.1985.325616.


