Quantitative Cross-Polarization Optical Coherence Tomography Detection of Infiltrative Tumor Margin in a Rat Glioma Model: a Pilot Study
Determining boundaries of infiltrative glial tumors remains a challenging problem in neurooncology. Optical coherence tomography (OCT) with cross-polarization (CP) visualization is a promising technique as a surgical guidance tool. However, the outcome of the procedures performed under OCT guidance strongly depends on the surgeon’s qualification. Thus, a quantitative method for assessing resection margins with OCT is required.
The aim of this study was to develop a robust quantitative approach for CP OCT data to differentiate tumorous from non-tumorous tissues in a rat glioma model.
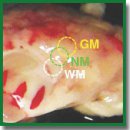
Materials and Methods. The study was carried out on the rats’ brains (n=6) with C6-glioma model injected into the right hemisphere. The left hemisphere was used as a control. The spectral domain CP OCT device that provides two images: in co- and cross-polarizations was used in the study. The central wavelength of probing light was 1310 nm, a spectral width of 100 nm, resulting in axial resolution of 10 µm. The lateral resolution is 15 μm. CP OCT images were collected ex vivo with non-contact forward-looking probe after brain excision and its sagittal crosscutting. A total of five CP OCT data sets were collected from each rat brain over the 2.4×2.4×1.25 mm OCT imaging volumes at the following locations: in the right hemisphere with C6-glioma at the center of the tumor site, at the tumor–non-tumor (white matter) margin; in the contralateral hemisphere of the brain (control) at a selected non-cancer sites: grey matter, gray–white matter margin, and visually normal white matter. Quantitative assessment of the different tissue types was based on calculating three optical coefficients: backscattering coefficients relation, attenuation coefficient, and forward cross-scattering coefficient. The CP OCT scanned tissue sites were marked and underwent histological verification.
Results. Сolor-coded maps of three optical coefficients for normal grey matter and its margin with white matter, C6-glioma and its margin with white matter were generated. Color-coded maps look more representative in margin detection in comparison with en-face CP OCT images. Every coefficient can differentiate white matter from other tissue types. Comparison of C6-glioma and gray matter color-coded maps reveal poor differentiation capability between these tissues.
Conclusion. A method for 3D CP OCT data quantification using co- and cross-scattering was developed and applied to OCT data volumes. Obtained values were plotted as color-coded maps of different brain tissues and brain tumor. A more accurate determination of tumor margins is obtained using processed CP OCT images in comparison with unprocessed initial images.
- Kohler B.A., Sherman R.L., Howlader N., Jemal A., Ryerson A.B., Henry K.A., Boscoe F.P., Cronin K.A., Lake A., Noone A.-M., Henley S.J., Eheman C.R., Anderson R.N., Penberthy L. Annual Report to the Nation on the Status of Cancer, 1975–2011, featuring incidence of breast cancer subtypes by race/ethnicity, poverty, and state. J Natl Cancer Inst 2015; 107(6): djv048, https://doi.org/10.1093/jnci/djv048.
- Ostrom Q.T., Gittleman H., Farah P., Ondracek A., Chen Y., Wolinsky Y., Stroup N.E., Kruchko C., Barnholtz-Sloan J.S. CBTRUS statistical report: primary brain and central nervous system tumors diagnosed in the United States in 2006–2010. Neuro Oncol 2013; 15(Suppl 2): ii1–ii56, https://doi.org/10.1093/neuonc/not151.
- Lichtenberg F.R. The expanding pharmaceutical arsenal in the war on cancer. National Bureau of Economic Research, Working Paper Series 2004; 10328, https://doi.org/10.3386/w10328.
- Almeida J.P., Chaichana K.L., Rincon-Torroella J., Quinones-Hinojosa A. The value of extent of resection of glioblastomas: clinical evidence and current approach. Curr Neurol Neurosci Rep 2014; 15(2): 517, https://doi.org/10.1007/s11910-014-0517-x.
- Sanai N., Berger M.S. Glioma extent of resection and its impact on patient outcome. Neurosurgery 2008; 62(4): 753–766, https://doi.org/10.1227/01.neu.0000318159.21731.cf.
- Sanai N., Polley M.Y., McDermott M.W., Parsa A.T., Berger M.S. An extent of resection threshold for newly diagnosed glioblastomas J Neurosurg 2011; 115(1): 3–8, https://doi.org/10.3171/2011.2.jns10998.
- Reulen H.J., Meinel T., Pichlmeier U., Schumacher W., Tonn J.C., Rohde V., Oppel F., Turowski B., Woiciechowsky C., Franz K., Pietsch T; ALA-Glioma Study Group. Extent of resection and survival in glioblastoma multiforme: identification of and adjustment for bias. Neurosurgery 2008; 62(3): 564–576, https://doi.org/10.1227/01.neu.0000317304.31579.17.
- McGirt M.J., Chaichana K.L., Gathinji M., Attenello F.J., Than K., Olivi A., Weingart J.D., Brem H., Quiñones-Hinojosa A.R. Independent association of extent of resection with survival in patients with malignant brain astrocytoma. J Neurosurg 2009; 110(1): 156–162, https://doi.org/10.3171/2008.4.17536.
- McGirt M.J., Chaichana K.L., Attenello F.J., Weingart J.D., Than K., Burger P.C., Olivi A., Brem H., Quinoñes-Hinojosa A. Extent of surgical resection is independently associated with survival in patients with hemispheric infiltrating low-grade gliomas. Neurosurgery 2008; 63(4): 700–708, https://doi.org/10.1227/01.neu.0000325729.41085.73.
- Sanai N., Berger M.S. Extent of resection influences outcomes for patients with gliomas. Rev Neurol (Paris) 2011; 167(10): 648–654, https://doi.org/10.1016/j.neurol.2011.07.004.
- Lacroix M., Abi-Said D., Fourney D.R., Gokaslan Z.L., Shi W., DeMonte F., Lang F.F., McCutcheon I.E., Hassenbusch S.J., Holland E., Hess K., Michael C., Miller D., Sawaya R. A multivariate analysis of 416 patients with glioblastoma multiforme: prognosis, extent of resection, and survival. J Neurosurg 2001; 95(2): 190–198, https://doi.org/10.3171/jns.2001.95.2.0190.
- Colditz M.J., Jeffree R.L. Aminolevulinic acid (ALA)–protoporphyrin IX fluorescence guided tumour resection. Part 1: Clinical, radiological and pathological studies. J Clin Neurosci 2012; 19(11): 1471–1474, https://doi.org/10.1016/j.jocn.2012.03.009.
- Zhao S., Wu J., Wang C., Liu H., Dong X., Shi C., Shi C., Liu Y., Teng L., Han D., Chen X., Yang G., Wang L., Shen C., Li H. Intraoperative fluorescence-guided resection of high-grade malignant gliomas using 5-aminolevulinic acid-induced porphyrins: a systematic review and meta-analysis of prospective studies. PLoS One 2013; 8(5): e63682, https://doi.org/10.1371/journal.pone.0063682.
- Eljamel S. 5-ALA fluorescence image guided resection of glioblastoma multiforme: a meta-analysis of the literature. Int J Mol Sci 2015; 16(5): 10443–10456, https://doi.org/10.3390/ijms160510443.
- Kubben P.L., ter Meulen K.J., Schijns O.E., ter Laak-Poort M.P., van Overbeeke J.J., van Santbrink H. Intraoperative MRI-guided resection of glioblastoma multiforme: a systematic review. Lancet Oncol 2011; 12(11): 1062–1070, https://doi.org/10.1016/s1470-2045(11)70130-9.
- Suero Molina E., Schipmann S., Stummer W. Maximizing safe resections: the roles of 5-aminolevulinic acid and intraoperative MR imaging in glioma surgery — review of the literature. Neurosurg Rev 2017; 18, https://doi.org/10.1007/s10143-017-0907-z.
- Kantelhardt S.R., Kalasauskas D., König K., Kim E., Weinigel M., Uchugonova A., Giese A. In vivo multiphoton tomography and fluorescence lifetime imaging of human brain tumor tissue. J Neurooncol 2016; 127(3): 473–482, https://doi.org/10.1007/s11060-016-2062-8.
- Vasefi F., MacKinnon N., Farkas D.L., Kateb B. Review of the potential of optical technologies for cancer diagnosis in neurosurgery: a step toward intraoperative neurophotonics. Neurophotonics 2016; 4(1): 011010, https://doi.org/10.1117/1.nph.4.1.011010.
- Yashin K.S., Kravets L.Y., Gladkova N.D., Gelikonov G.V., Medyanik I.A., Karabut M.M., Kiseleva E.B., Shilyagin P.A. Optical coherence tomography in neurosurgery. Voprosy neirokhirurgii imeni N.N. Burdenko 2017; 81(3): 107–115, https://doi.org/10.17116/neiro2017813107-115.
- Huang D., Swanson E.A., Lin C.P., Schuman J.S., Stinson W.G., Chang W., Hee M.R., Flotte T., Gregory K., Puliafito C.A., Fujimoto J.G. Optical coherence tomography. Science 1991; 254(5035): 1178–1181, https://doi.org/10.1126/science.1957169.
- Kut C., Chaichana K.L., Xi J., Raza S.M., Ye X., McVeigh E.R., Rodriguez F.J., Quinones-Hinojosa A., Li X. Detection of human brain cancer infiltration ex vivo and in vivo using quantitative optical coherence tomography. Sci Transl Med 2015; 7(292): 292ra100–292ra100, https://doi.org/10.1126/scitranslmed.3010611.
- Sun C., Lee K. K.C., Vuong B., Cusimano M., Brukson A., Mariampillai A., Standish B.A., Yang V.X.D. Neurosurgical hand-held optical coherence tomography (OCT) forward-viewing probe. Photonic Therapeutics and Diagnostics VIII 2012; 82074V, https://doi.org/10.1117/12.909116.
- Lankenau, E., Klinger D., Winter C., Malik A., Müller H.H., Oelckers S., Pau H.-W., Just T., Hüttmann G. Combining optical coherence tomography (OCT) with an operating microscope. Advances in Medical Engineering 2007; 114: 343–348, https://doi.org/10.1007/978-3-540-68764-1_57.
- El-Haddad M.T., Tao Y.K. Advances in intraoperative optical coherence tomography for surgical guidance. Biomed Opt Express 2017; 3: 37–48, https://doi.org/10.1016/j.cobme.2017.09.007.
- Böhringer H.J., Lankenau E., Stellmacher F., Reusche E., Hüttmann G., Giese A. Imaging of human brain tumor tissue by near-infrared laser coherence tomography. Acta Neurochir (Wien) 2009; 151(5): 507–517, https://doi.org/10.1007/s00701-009-0248-y.
- Yuan W., Kut C., Liang W., Li X. Robust and fast characterization of OCT-based optical attenuation using a novel frequency-domain algorithm for brain cancer detection. Sci Rep 2017; 7: 44909, https://doi.org/10.1038/srep44909.
- Al Kharousi N., Wali U.K., Azeem S. Chapter 1. Current applications of optical coherence tomography in ophthalmology. In: Optical coherence tomography. Edited by Kawasaki M. InTech; 2013, https://doi.org/10.5772/53961.
- Tsai T.-H., Leggett C.L., Trindade A.J., Sethi A., Swager A.-F., Joshi V., Bergman J.J., Mashimo H., Nishioka N.S., Namati E. Optical coherence tomography in gastroenterology: a review and future outlook. J Biomed Opt 2017; 22(12): 121716, https://doi.org/10.1117/1.jbo.22.12.121716.
- Wang H.-W., Chen Y. Clinical applications of optical coherence tomography in urology. Intravital 2014; 3(1): e28770, https://doi.org/10.4161/intv.28770.
- Wang H., Akkin T., Magnain C., Wang R., Dubb J., Kostis W.J., Yaseen M.A., Cramer A., Sakadžić S., Boas D. Polarization sensitive optical coherence microscopy for brain imaging. Opt Lett 2016; 41(10): 2213–2216, https://doi.org/10.1364/ol.41.002213.
- Boas D.A., Wang H., Magnain C., Fischl B. Polarization-sensitive optical coherence tomography of the human brain connectome. SPIE Newsroom 2017, https://doi.org/10.1117/2.1201701.006834.
- Gubarkova E.V., Dudenkova V.V., Feldchtein F.I., Timofeeva L.B., Kiseleva E.B., Kuznetsov S.S., Shakhov B.E., Moiseev A.A., Gelikonov G.V., Vitkin A., Gladkova N.D. Multi-modal optical imaging characterization of atherosclerotic plaques. J Biophotonics 2016; 9(10): 1009–1020, https://doi.org/10.1002/jbio.201500223.
- Gladkova N., Kiseleva E., Robakidze N., Balalaeva I., Karabut M., Gubarkova E., Feldchtein F. Evaluation of oral mucosa collagen condition with cross-polarization optical coherence tomography. J Biophotonics 2013; 6(4): 321–329, https://doi.org/10.1002/jbio.201200059.
- Yashin К.S., Karabut M.M., Fedoseeva V.V., Khalansky A.S., Matveev L.A., Elagin V.V., Kuznetsov S.S., Kiseleva E.B., Kravets L.Y., Medyanik I.А., Gladkova N.D. Multimodal optical coherence tomography in visualization of brain tissue structure at glioblastoma (experimental study). Sovremennye tehnologii v medicine 2016; 8(1): 73–81, https://doi.org/10.17691/stm2016.8.1.10.
- Yashin К.S., Gubarkova E., Kiseleva E., Kuznetsov S.S., Karabut M.M., Medyanik I.А., Kravets L.Y., Gladkova N.D. Ex vivo visualization of human gliomas by cross-polarization optical coherence tomography: pilot study. Sovremennye tehnologii v medicine 2016; 8(4): 14–21, https://doi.org/10.17691/stm2016.8.4.02.
- Gelikonov V.M., Gelikonov G.V. New approach to cross-polarized optical coherence tomography based on orthogonal arbitrarily polarized modes. Laser Physics Letters 2006; 3(9): 445–451, https://doi.org/10.1002/lapl.200610030.
- Matveev L.A., Zaitsev V.Y., Gelikonov G.V., Matveyev A.L., Moiseev A.A., Ksenofontov S.Y., Gelikonov V.M., Sirotkina M.A., Gladkova N.D., Demidov V., Vitkin A. Hybrid M-mode-like OCT imaging of three-dimensional microvasculature in vivo using reference-free processing of complex valued B-scans. Opt Lett 2015; 40(7): 1472–1475, https://doi.org/10.1364/ol.40.001472.