Functional Connectivity of Neural Network in Dissociated Hippocampal Culture Grown on Microelectrode Array
Dissociated neural cultures are used as convenient experimental models to study basic mechanisms of brain signal processing, memory, learning and synaptic plasticity in neuronal networks. Evaluation of short-term and long-term memory in hippocampal cultures requires simultaneous multisite recording of signals and bioelectrical stimulation.
The aim of the investigation was to reveal the characteristic features of neuronal network plasticity in the model of primary hippocampal cell cultures, to study the stability of spontaneous and stimulus-induced changes in spiking patterns of cultures.
Materials and Methods. Long-term changes in functional connectivity characteristics of spikes propagating in the neural network of hippocampal culturesgrown on microelectrode arrays were evaluated. It was investigated how low-frequency stimulation (0.1–0.5 Hz) lying in the frequency band of spontaneous bursting activity altered functional connections in the network at different time scales.
Results. Low-frequency stimulation of hippocampal culturesgrown on microelectrode arrays was found to induce reconfiguration of the network connectivity. This effect could be preserved during tens of minutes. On the time scale of hours, stimulation-induced connectivity pattern disappeared due to spontaneous changes.
Dissociated neural cultures grown on microelectrode arrays are widely used as convenient models to study the fundamental mechanisms of brain signal processing, memory, learning and synaptic plasticity in neuronal networks [1–4]. Low-frequency stimulation of neuronal cultures is known to evoke network bursts whose patterns depend on the location of the stimulating electrode [5, 6]. The induced reverberating bursts play a key role in changing functional connectivity of neural networks [7–11]. Cultures of dissociated neural cells are known to display dominant spontaneous activity patterns that enhance the existing connectivity [12]. Low-frequency stimulation by one electrode induces generation of network responses organized as reverberating activity bursts different from the dominant spontaneous activity pattern. Such stimulation alters signal propagation pathways and induces connectivity changes [12]. Several research groups have shown that low-frequency stimulation may induce network plasticity [13–15].
However, spontaneous electrical activity in cultured neural networks demonstrates a high level of variability in the functioning of mature cultures for more than 30 days in vitro [16]. This variability can be associated with spontaneous synaptic plasticity changes due to the presence of cyclic connections in the neural network. The spontaneous changes of functional connectivity in the network may interfere with stimulus-induced changes. To reveal stimulus-induced synaptic connectivity, it is important to measure the dynamics of spontaneous changes in the network.
The aim of the investigation was to evaluate long-term changes in functional characteristics of spikes propagating in the neural network of hippocampal cultures grown on microelectrode array.
In this study we performed long-term experiments recording spontaneous activity of the neural network. Low-frequency voltage stimulation was applied through 12 electrodes to induce bursting responses in certain locations of the network. We hypothesized that changes in functional connectivity of the network were induced by synaptic plasticity. Functional connectivity was estimated by cross-correlation analysis of spiking patterns of spontaneous network activity recorded through different microelectrodes (by analogy with [17]). Connectivity changes induced by electrical stimulation were found on the time scale of 20 min. Besides, low-frequency stimulation changed burst initiation pattern (a propagation pathway of the signal inducing burst initiation) and spiking rate of spontaneous network activity.
Materials and Methods
Cell culture. Hippocampal cells were dissociated from embryonic mice (E18) and plated on 60-electrode microelectrode arrays (MEAs) (Multi Channel Systems MCS, GmbH, Germany) at final density of approximately 9,000–10,000 cells/mm2 [18]. One half of the medium was replaced by new one every 2 days. The cells were cultured under constant conditions at 35.5°C, 5% CO2 and 95% air humidity in cell culture incubator (MCO-18AIC, Sanyo, Japan). Experiments were performed when the cultures were 3–5 weeks in vitro.
Recording and electrical stimulation of cultured cells. Signals were recorded from microelectrode array with 59 planar electrodes of 30 μm diameter and 200 μm inter-electrode distance and 1 reference electrode. Spikes were detected using threshold estimated for each channel separately based on the noise statistics. The amplitudes of detected spikes were in the range of 10–80 μV. Signal analysis and statistic calculations were performed using custom-made software developed in Matlab [5]. Voltage pulse stimulation (±600 mV, 260 µs per phase, the first phase positive) was applied. Experimental protocol consisted of 3 h of spontaneous activity recordings before and after stimulation. The 3-hour recordings were divided into 60- and 20-minute intervals for analysis. Low-frequency voltage stimulation protocol included 30 pulses per each of 12–15 electrodes with 5-seconds inter-stimulus interval (Figure 1).
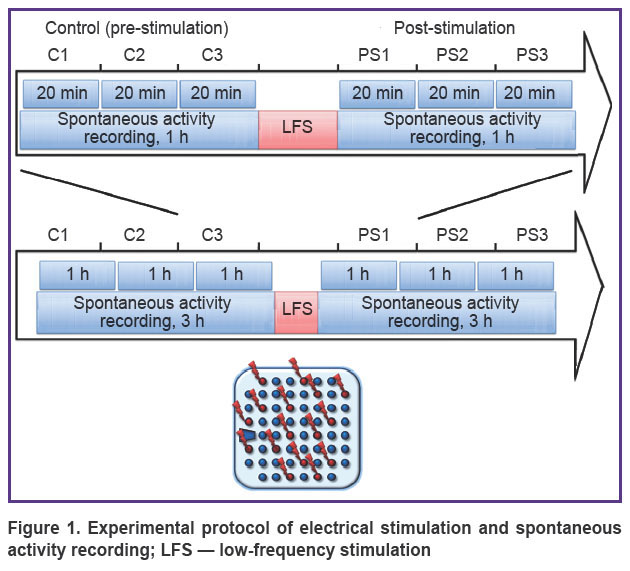 |
Figure 1. Experimental protocol of electrical stimulation and spontaneous activity recording; LFS — low-frequency stimulation |
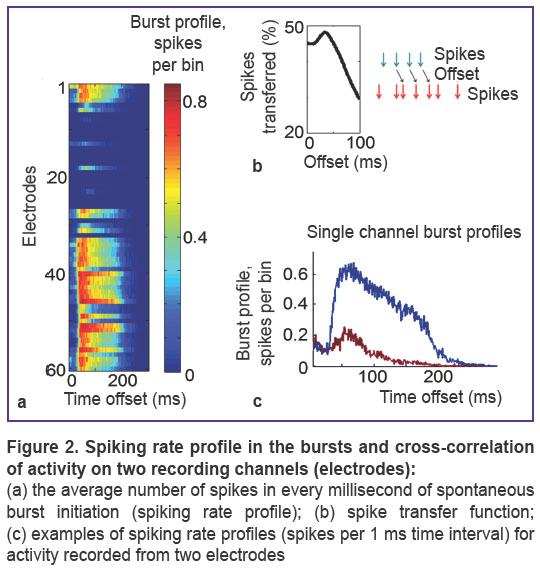
Connectivity analysis. Cross-correlation of activity observed in each electrode pair (i, j) was calculated as a percentage of spikes from i-th electrode recorded on j-th electrode with various time delays. We used the term ‘connection delay’ to denote the time delay corresponding to the maximum of cross-correlation function which was regarded as connection strength. If connection delay was longer than 3 ms (Figure 2), the pair of electrodes was treated as synaptically connected [17]. Connectivity map characterized by connection strength and connection delay was constructed for each 20- or 60-minutes raster. To measure connectivity changes over time, each recording was compared with the first recording and two parameters were calculated: connectivity coefficient (ADC%) calculated as the percentage of appeared and disappeared connections and stable connection strength change (SCSC) coefficient determined as the mean difference between connection strengths detected in both recordings. SCSC was measured in percentage accounting for the difference between the maxima of cross-correlation function characterizing the number of transmitted spikes.
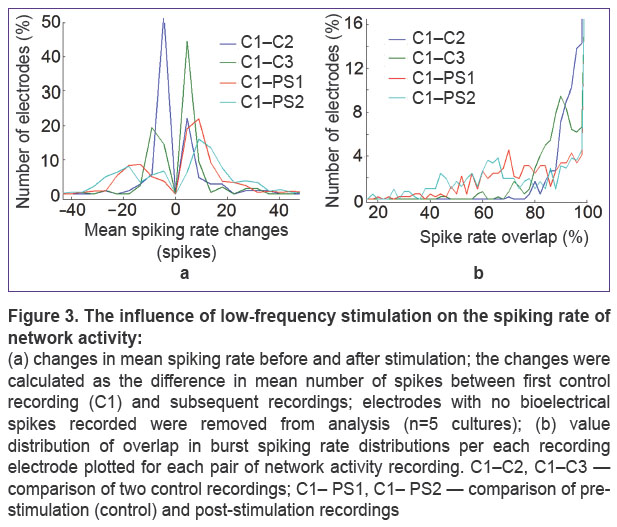
Bursting activity comparison. Mean spiking rates per burst were compared for each electrode and each pair of recordings (rasters), respectively. The differential was determined as the difference between the mean number of spikes per burst for each pair of recordings (rasters), for each recording electrode separately (Figure 3 (a)). The difference in spiking rates per burst for each pair of recordings (rasters) for each electrode was quantified using the parameter denoted as overlap in burst spiking rate distributions. To calculate this parameter, we used the methods of clustering two sets of burst spiking rates. K-means clustering method was applied to all bursts for each pair of recordings (rasters A and B). As a result, the bursts were divided into two data sets (A’ and B’). The sets of bursts with known raster origins (sets A and B) we compared to the set of bursts after cluster analysis (A’ and B’). In this case, classification error was represented as the number of the patterns identified incorrectly as to the recording source (Na=A’∩B and Nb=B’∩A), where Na was the number of bursts from set B referred to set A by K-means clustering, Nb was the number of bursts from set A referred to set B by K-means clustering.
Percentage ratio of such patterns to the total number of bursts ([Na+Nb])/Nc·100%, where Nc is the total number of bursts in rasters A and B) was defined as the overlap in burst spiking rate distributions for two recordings and varied in the range 0–100%. In contrast to statistical test, such measure represents the degree of difference. Thus, the overlap can equal 0%, if all values of the spiking rates from one raster are greater than the spiking rates from the other raster or vice versa.
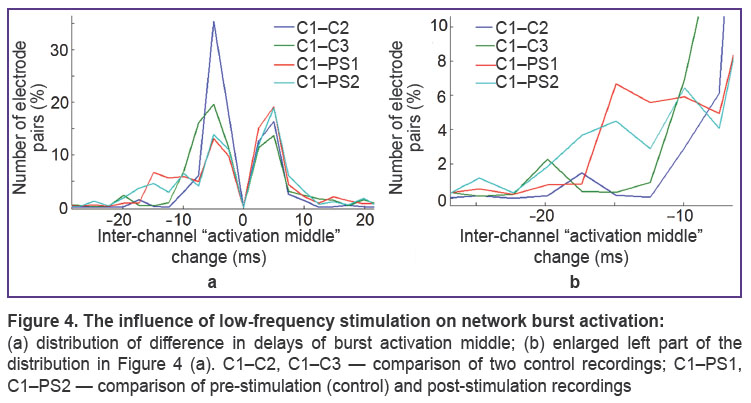
Besides, we compared activation middle parameters defined as the time when activity reaches 50% of maximum spiking rate per 1 ms on each electrode separately. The difference in activation middle for each pair of recordings (rasters) was determined as the difference between delays of burst activation middle separately for each recording electrode.
Results
Stimulus-induced spiking rate changes. Dissociated hippocampal cultures (E18) were plated on microelectrode arrays and grown for 40 days. Spontaneous bursting activity was recorded daily for 7–8 h starting from day 20 (3 h before stimulation, 20 min stimulation, 3 h after stimulation and the first 0.5–1.5 h were not included in the analysis as mechanical vibration leads to changes in bursting activity when cell cultures are moved). Connectivity was estimated in each 60- and 20-minute time interval before and after stimulation. The recorded activity was consistent with the results obtained earlier [18].
Further, it was investigated whether low-frequency stimulation with inter-pulse interval equal to the interval between the bursts of spontaneous activity (0.1–0.5 Hz) induced spiking rate changes in the bursts. We analyzed the parameters of mean spiking rate change and overlaps in burst spiking rate distributions for each channel before and after stimulation. Three recordings of spontaneous bursting activity were divided into one-hour and 20-minute intervals (See Figure 1). Spiking rate changes induced by low-frequency stimulation were more considerable than spontaneous changes but only within a small group of the electrodes (network sites) (Figure 3 (a), (c)). The number of electrodes with the value of mean spiking rate change >20 and more significant spiking rate overlaps increased after stimulation. Some electrodes were found to show the increase of spiking rate in the bursts during 2 h after stimulation.
Burst activation changes induced by low-frequency stimulation. The dominant pathway of signal propagation was determined based on delays of burst activation for different parts of the network. Burst activation middle was analyzed for each channel before and after stimulation. Changes in burst activation induced by low-frequency stimulation were more significant than spontaneous changes on a small group of electrodes (network sites) (Figure 4 (a), (c)).
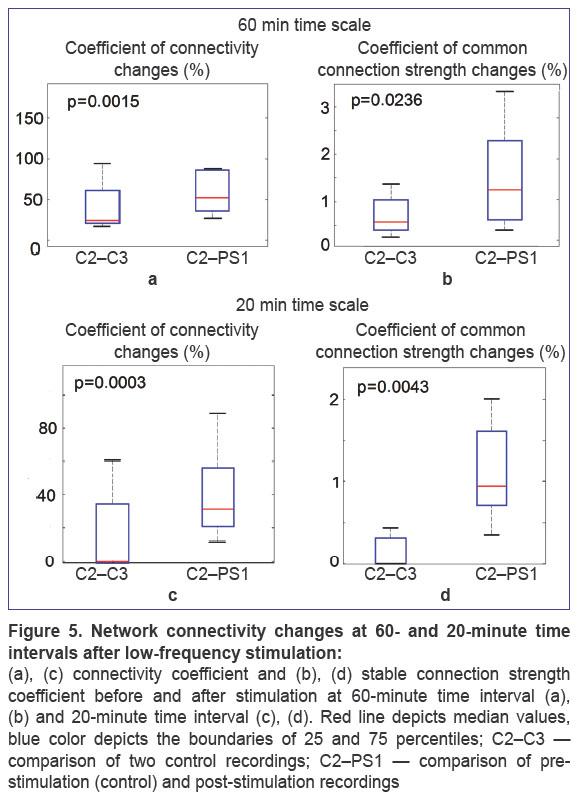
Connectivity reorganization in the network. Connectivity changes induced by stimulation were studied by analyzing the sequence of three-hour activity: two one-hour raster plots recorded before stimulation and one-hour plot recorded after stimulation. We analyzed connectivity coefficient (ADC%) (the number of appeared/disappeared connections) during each hour comparing each raster plot to the connectivity at the first hour of recording (C1: pre-stimulation (control), PS1: post-stimulation). Statistical significance of the found difference was estimated using Mann–Whitney U test, p<0.01, n=5 (Figure 5 (a)). Median ADC% values for pre- and post-stimulation data were 31.0 and 54.4, respectively (i.e. they changed by 1.75 times). Differences (Mann–Whitney U test, p<0.05, n=5) were also found when SCSC. The medians were 0.006 and 0.0125, their relative difference was 2.08. However, at the time scales of 20 min the differences in SCSC coefficient were more significant (Man–Whitney U test, p<0.001). The medians of ADC% coefficient were 0.5 in control and 33.1 when comparing pre- and post-stimulation activity (Figure 5 (c)). The relative change was 66.2 in contrast to 1.75 for 60-minute recordings. SCSC coefficient medians equaled 0.0001 in control and 0.0095 comparing pre- and post-stimulation activity. The relative change was 95.0 in contrast to 2.08 for 60-minute recordings.
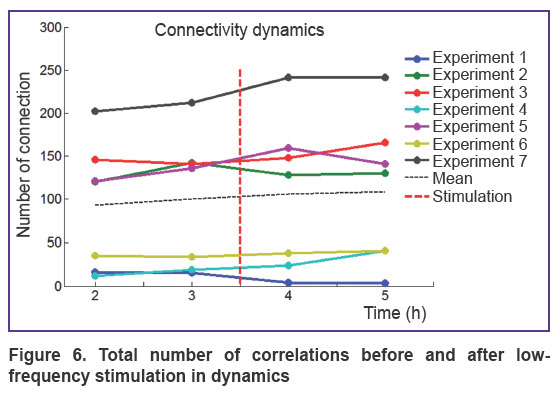
The total number of connections at 60-minute time interval was found to remain unchanged after the stimulation (Figure 6). Significant changes in SCSC coefficient and change in connectivity coefficient ADC% clearly demonstrated reorganization of functional connectivity in the network after low-frequency stimulation.
|
Figure 6. Total number of correlations before and after low-frequency stimulation in dynamics |
Discussion. In this study, dissociated hippocampal neurons were cultured on microelectrode arrays. Spontaneous bursting activity was recorded for several hours (up to 8 h), then low-frequency electrical stimulation was applied. Two stimulation protocols were applied: low- and high-frequency stimulation. Low-frequency stimulation was performed through 12 randomly selected electrodes at 0.1–0.5 Hz, high-frequency stimulation — through 2 channels and 8 electrodes (4 electrodes per one stimulation channel). There were applied 150 series, each consisting of 20 stimuli, the time interval between stimuli was 100 ms, between series — 6 s, the delay between the stimuli of the first and the second channels equaled 10 ms. The recorded activity was divided into 60- and 20-minute intervals and followed by spike-transfer function analysis to estimate connectivity.
Functional connectivity was estimated by cross-correlation analysis of spiking patterns of spontaneous network activity recorded through different microelectrodes (by analogy with [17]). The paper by le Feber [12] demonstrates that the integral indicator of neuronal network connectivity reorganization (Euclidean space between connectivity strength matrices for all pairs of recording electrodes before and after stimulation) changes after electrical stimulation.
We have developed the indicators of neuronal network activity alteration: connectivity coefficient, stable connection strength change coefficient, mean spiking rate change, overlap in burst spiking rate distributions, the difference in delays of burst activation middle, which provide the possibility to evaluate functional connectivity of neuronal network. Changes in connectivity strength and connectivity reorganization (number of appeared/disappeared connections) indicate significant functional changes in culture network due to low-frequency stimulation. It should be noted that, at the same time, the total number of connections remained unchanged.
Using the introduced indicators, it has been established for the first time that neuronal network activity alteration observed on the time scale of 20 min is much more profound than that on the time scale of 1 h. This suggests that spontaneous network connectivity changes may inhibit the changes induced by stimulation.
The introduced indicators of neuronal network activity alteration provide efficient and simple tools for evaluation of functional state of neural networks in vitro when lengthy electrophysiological recordings on microelectrode arrays are made. These indicators can be applied in studies on testing pharmacological drugs intended to improve or rehabilitate the functional state of neuronal tissue.
Conclusion. Electrical stimulation by short two-phase square-wave pulses (±800 mV, 260 µs per phase, positive first) of low frequency (at 3-second inter-stimulus interval during 20 min) causes functional changes in the network of durably cultured dissociated brain cells, particularly, the changes in connectivity architecture of network activity with stable total quantity of cross-correlation connections. The developed indicators, connectivity coefficient and stable connection strength change coefficient appear to be reliable indicators of activity-dependent plasticity in neuronal network. Changes in the parameters of mean spiking rate, overlap in burst spiking rate distributions, difference in delays of burst activation middle after the stimulation are observed only within a few network sites (recording electrodes). Neuronal network activity alteration induced by low-frequency stimulation can be preserved for tens of minutes. At a long time interval (1 h), spontaneous connectivity changes inhibit stimulation-induced pattern.
Study Funding. This study was supported by the Russian Science Foundation (No.14-19-01381).
Conflict of Interests. The authors have no conflicts of interest to disclose.
References
- Chiappalone M., Massobrio P., Martinoia S. Network plasticity in cortical assemblies. Eur J Neurosci 2008; 28(1): 221–237, https://doi.org/10.1111/j.1460-9568.2008.06259.x.
- Bakkum D.J., Chao Z.C., Potter S.M. Long-term activity-dependent plasticity of action potential propagation delay and amplitude in cortical networks. PLoS One 2008; 3(5): e2088, https://doi.org/10.1371/journal.pone.0002088.
- Eytan D., Brenner N., Marom S. Selective adaptation in networks of cortical neurons. J Neurosci 2003; 23(28): 9349–9356.
- Marom S., Shahaf G. Development, learning and memory in large random networks of cortical neurons: lessons beyond anatomy. Q Rev Biophys 2002; 35(01): 63–87, https://doi.org/10.1017/s0033583501003742.
- Pimashkin A., Kastalskiy I., Simonov A., Koryagina E., Mukhina I., Kazantsev V. Spiking signatures of spontaneous activity bursts in hippocampal cultures. Front Comput Neurosci 2011; 5: 46, https://doi.org/10.3389/fncom.2011.00046.
- Shahaf G., Eytan D., Gal A.,
Kermany E., Lyakhov V., Zrenner C., Marom S. Order-based representation in random networks of cortical neurons. PLoS Comput Biol 2008; 4(11): e1000228, https://doi.org/10.1371/journal.pcbi.1000228. - Maccione A., Garofalo M.,
Nieus T., Tedesco M., Berdondini L., Martinoia S. Multiscale functional connectivity estimation on low-density neuronal cultures recorded by high-density CMOS Micro Electrode Arrays. J Neurosci Methods 2012; 207(2): 161–171, https://doi.org/10.1016/j.jneumeth.2012.04.002. - Makarov V.A., Panetsos F., de Feo O. A method for determining neural connectivity and inferring the underlying network dynamics using extracellular spike recordings. J Neurosci Methods 2005; 144(2): 265–279, https://doi.org/10.1016/j.jneumeth.2004.11.013.
- Ullo S.,
Nieus T.R., Sona D., Maccione A., Berdondini L., Murino V. Functional connectivity estimation over large networks at cellular resolution based on electrophysiological recordings and structural prior. Front Neuroanat 2014; 8: 137, https://doi.org/10.3389/fnana.2014.00137. - Wagenaar D.A. Controlling bursting in cortical cultures with closed-loop multi-electrode stimulation. J Neurosci 2005; 25(3): 680–688, https://doi.org/110.1523/jneurosci.4209-04.2005.
- Poli D., Pastore V.P., Massobrio P. Functional connectivity
in in vitro neuronal assemblies. Front Neural Circuits 2015; 9: 57, https://doi.org/10.3389/fncir.2015.00057. - le Feber J., Witteveen T., van Veenendaal T.M., Dijkstra J. Repeated stimulation of cultured networks of rat cortical neurons induces parallel memory traces. Learn. Mem 2015; 22(12): 594–604, https://doi.org/10.1101/lm.039362.115.
- Bologna L.L.,
Nieus T., Tedesco M., Chiappalone M., Benfenati F., Martinoia S. Low-frequency stimulation enhances burst activity in cortical cultures during development. Neuroscience 2010; 165(3): 692–704, https://doi.org/10.1016/j.neuroscience.2009.11.018. - Maeda E., Kuroda Y., Robinson H.P.C., Kawana A. Modification of parallel activity elicited by propagating bursts in developing networks of rat cortical
neurones . Eur J Neurosci 1998; 10(2): 488–496, https://doi.org/10.1046/j.1460-9568.1998.00062.x. - Vajda I., van Pelt J., Wolters P., Chiappalone M., Martinoia S., van Someren E., van Ooyen A. Low-frequency stimulation induces stable transitions in stereotypical activity in cortical networks. Biophys J 2008; 94(12): 5028–5039, https://doi.org/10.1529/biophysj.107.112730.
- Wagenaar D.A., Pine J., Potter S.M. An extremely rich repertoire of bursting patterns during the development of cortical cultures. BMC Neurosci 2006; 7(1): 11, https://doi.org/10.1186/1471-2202-7-11.
- le Feber J., Rutten W.L., Stegenga J., Wolters P.S., Ramakers G.J., van Pelt J. Conditional firing probabilities in cultured neuronal networks: a stable underlying structure in widely varying spontaneous activity patterns. J Neural Eng 2007; 4(2): 54–67, https://doi.org/10.1088/1741-2560/4/2/006.
- Pimashkin A., Gladkov A.,
Agrba E., Mukhina I., Kazantsev V. Selectivity ofstimulus induced responses in cultured hippocampal networks on microelectrode arrays. Cogn Neurodyn 2016; 10(4): 287–299, https://doi.org/10.1007/s11571-016-9380-6.
