Study of Minor Chromophores in Biological Tissues by Diffuse Optical Spectroscopy (Review)
Diffuse optical spectroscopy (DOS) is a rapidly advancing non-invasive diagnostic technique to investigate biological tissue, based on probing the target object with optical radiation in the visible and/or near-infrared wavelength range and detecting the diffusely scattered light from the tissue. The signals obtained through DOS provide extensive information about the biochemical composition of tissues due to the presence of light-absorbing compounds known as chromophores. To date, DOS is widely employed to detect major chromophores such as deoxygenated (Hb) and oxygenated (HbO2) hemoglobin, water, lipids, and melanin. The concentrations of Hb and HbO2 in biological tissues are highly significant in clinical research, as they offer valuable insights into tissue oxygenation status and enable the detection of hypoxia. However, biological tissues also contain less-studied chromophores — minor chromophores — which also contribute to the overall absorption spectrum. These include various globins, such as methemoglobin, carboxyhemoglobin, and myoglobin, as well as cytochromes and cytochrome c oxidase. Identifying minor chromophores using DOS is challenging due to their relatively low absorption contributions compared to major chromophores, as well as the limited understanding of their specific absorption spectra. Nevertheless, the simultaneous detection of both major and minor chromophores could provide a comprehensive understanding of metabolic processes within vascular, intracellular, and mitochondrial compartments of tissues. This would substantially expand the potential applications of DOS in both research and clinical studies. In this review we examine literature sources that explore the investigation of minor chromophores in biological tissues by DOS, discuss the role of major chromophores, and evaluate the potential for simultaneous detection of both major and minor chromophores with DOS.
Introduction
Optical methods for measuring physiological parameters of biological tissues are widely used in fundamental and clinical research due to their non-invasiveness, relatively low cost, compact equipment, and high information content. Tissue composition can be analyzed using various optical spectroscopic techniques, including Raman spectroscopy [1], elastic scattering (optical diffusion methods) [2, 3], and fluorescence methods [4]. While Raman spectroscopy and fluorescence techniques offer valuable insights, the detected signal levels in these methods are relatively low, which limits the depth of investigation. In contrast, optical diffusion methods offer significantly higher signal levels, enabling much greater penetration depths.
Diffuse optical spectroscopy (DOS) is a non-invasive diagnostic technique that allows for the assessment and monitoring of the biochemical state of tissues. DOS is widely employed for investigating brain hemodynamics (fNIRS) [5, 6], diagnosing and tracking malignant tumors [7–10] along with their microenvironment [11], evaluating scar severity and keloid treatment responses [12], early detection of pressure ulcers [13], assessing burn wound status [14], and various other applications. Additionally, it is employed for non-biomedical purposes, such as determining meat freshness [15] and conducting soil analysis [16]. DOS is based on probing the object with broadband optical and/or near-infrared radiation, recording the diffusely scattered light from the tissue, and solving the inverse problem of reconstructing the concentrations of tissue chromophores [17, 18]. The signal recorded by DOS carries information about both scattering, which is related to the tissue’s microstructure, and absorption, which reflects its biochemical composition [19]. The reconstruction of chromophore concentrations is possible due to the distinct partial absorption spectra of these compounds.
The accuracy of reconstructing chromophore concentrations is affected by numerous factors. For instance, distinguishing between chromophores with similar absorption spectra, such as hemoglobin and myoglobin, poses a significant challenge. Additionally, isolating the absorption contribution of a minor chromophore with a low concentration from that of a chromophore with a high absorption coefficient is challenging. Traditional models of light propagation in tissues, based on solving the radiative transfer equation in the diffusion approximation, have significant limitations for closely spaced sources and detectors and/or in cases of high absorption coefficients. This urge researches to create refined models. Furthermore, literature data on the absorption spectra of various chromophores often exhibit significant variations, which may reflect high sample variability and, ultimately, reduce the accuracy of reconstruction. Therefore, researchers often include only major chromophores, oxy- and deoxyhemoglobin (HbO2 and Hb), in the inverse problem of DOS, as they contribute the most to light absorption. However, data on the concentration of these chromophores alone enable the investigation of important physiological parameters, including tissue oxygenation and blood filling. Less commonly, studies assess water content to evaluate edema [20] or melanin content for melanoma diagnosis [21]. Studies on minor chromophores, such as methemoglobin (MetHb), myoglobin, carboxyhemoglobin (HbCO), cytochromes, and cytochrome c oxidase using DOS, are far less prevalent in the literature, despite their potential importance in addressing various biomedical challenges.
The difficulty in assessing the content of minor chromophores in tissue arises from their low concentrations, which result in minimal contributions to the overall absorption. Their detection requires highly sensitive measurements of tissue diffuse reflectance spectra, preferably over a wide wavelength range, as well as their inclusion in the diffuse scattering model. Moreover, available data on the partial absorption spectra of these chromophores are often limited in accuracy and the wavelength range covered by laboratory measurements.
In this review, literary sources containing information on minor chromophores of biological tissues were analyzed. Additionally, this paper provides data on major chromophores in biological tissues (water, lipids, melanin, and hemoglobin), as well as the possibility of their simultaneous study with minor chromophores. Special attention is given to studies that consider the measurement of minor chromophore concentrations using DOS. Also, brief information on DOS technology is also provided, with a focus on its potential for detecting minor chromophores.
The literature search was conducted using the PubMed, Scopus, and RSCI databases employing the following key words: absorption, bilirubin, chromophores, cytochrome c, diffuse reflectance spectroscopy, melanin, methemoglobin, near-infrared spectroscopy, oxygen saturation, scattering.
Diagnosis of biological tissues using diffuse optical spectroscopy
There are various configurations of sources irradiating the tissue and detectors recording radiation diffusely scattered by the tissue for DOS registration. These configurations include transmission, reflection, circular and arbitrary arrangements. Transmission, circular and arbitrary configurations are typically used for specific locations where the study is conducted, such as the breast [22], hand joints [23], feet [24], etc. Such configurations allow for the collection of absorption data from large tissue volumes, including deeply located structures such as tumors and joints. A large depth of light penetration, up to several centimeters, can only be achieved within the therapeutic window of tissue transparency (700–1000 nm), where tissue absorption is minimal. However, within this range, the number of tissue chromophores contributing significantly to absorption is limited primarily to hemoglobin, water, and lipids. The absorption contributions of minor chromophores are challenging to isolate due to their low concentrations and the absence of pronounced peaks in the absorption spectrum.
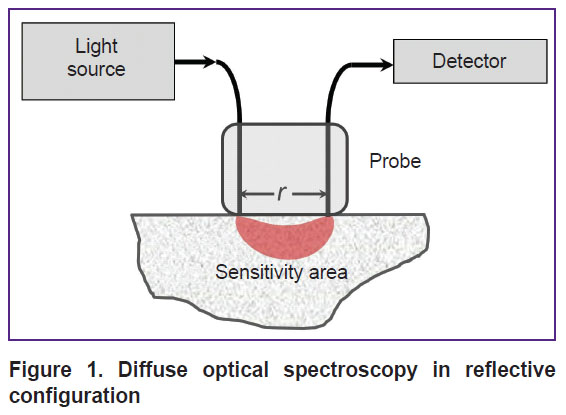
In DOS systems with a reflective configuration, known as diffuse reflectance spectroscopy, a contact fiber-optic probe with one emitting and one receiving fiber is most commonly used (Figure 1). The distance between the source and detector can be adjusted based on the desired signal level and investigation depth. For example, in DOS studies using the visible wavelength range, the distance between the source and detector is typically limited to 5 mm due to strong light attenuation in tissues. Nevertheless, the visible wavelength range is particularly valuable for detecting minor tissue chromophores. More complex configurations with multiple sources and detectors can also be used to obtain spectroscopic data at different depths [25] or to mitigate the influence of instrumental functions, such as ratiometric approach or self-calibration method [19, 26].
|
Figure 1. Diffuse optical spectroscopy in reflective configuration |
When studying biological tissues using the DOS method, the multiple scattered diffuse component of light is recorded. The attenuation of this component depending on the source-detector distance r follows an exponential law with the extinction coefficient µeff , which is determined by the absorption coefficient µa and the transport scattering coefficient µ’s as follows:

The most common analytical model for describing diffusely scattered light is the solution to the radiative transfer equation in the diffusion approximation for a semi-infinite homogeneous scattering and absorbing medium, considering the directionality of the radiation source [27]. Advanced models also account for factors such as the detector fiber’s acceptance angle [28] or the characteristics of the scattering phase function [29], which are particularly significant when the source and detector overlap spatially.
The extinction coefficient for a homogeneous scattering and absorbing tissue can be estimated by measuring the intensity of diffusely scattered light at two source-detector distances. It is also acceptable to use measurements with a single source–detector distance, but this requires calibration of the DOS system on a model medium (tissue phantoms).
The absorption coefficient µa, included in the extinction coefficient (1), can be expressed as a weighted sum of the absorption spectra of endogenous chromophores in the tissue [30]:

where Ci is the concentration of the i-th chromophore, and µia(λ) is the absorption coefficient of the i-th chromophore at a given wavelength λ. This equation implies that the maximum number of chromophores that can be reconstructed from DOS measurements corresponds to the number of spectral lines at which the measurement is performed. However, even with a large number of spectral lines achieved using broadband source and a spectrometer, the reconstruction of a large number of chromophores is not guaranteed. One reason for this limitation is that diffuse scattering depends on both the absorption and the scattering coefficient, the latter of which is also unknown.
Hardware-based separation of scattering and absorption coefficients is possible using time-domain or frequency-domain methods [31–33]. These methods are particularly effective for large source–detector distances (several centimeters), where photons undergo sufficient scattering events to measure their time delay or a phase shift of a photon density wave. However, for the visible wavelength range, where source-detector distances are small, implementing these methods requires extremely high modulation frequencies (several gigahertz), posing significant technical challenges.
The SFDI method (spatial frequency domain imaging) represents a more promising approach for separating the absorption coefficients µa and µ’s in both visible and NIR wavelength ranges. However, as with the time-domain or frequency-domain approach, its implementation requires multiple light sources at different wavelengths and an image configurator, typically a specialized digital light processing matrix. Thus, SFDI is technically complex, costly and requires significant data acquisition time to acquire at least three images for each spatial frequency at each wavelength.
In most cases, the scattering spectrum used to solve the inverse problem in DOS is either derived from literature data specific to the tissue type or simplified by parameterizing it with a few parameters, assuming its monotonic decline as the wavelength increases. A comprehensive parametric formula for the transport scattering coefficient spectrum includes two components: Rayleigh scattering, which exhibits a –4th power dependence on wavelength, describing scattering by particles smaller than the wavelength, and a component characterizing scattering by large particles with a power exponent b<4 [18, 34], which depends on the average size of these particles:
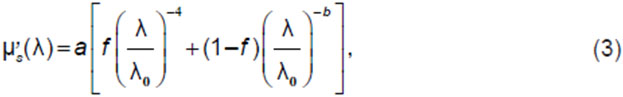
where a is the reduced scattering coefficient at λ0=50 nm, f is the fraction of Rayleigh scattering. It is assumed that Rayleigh scattering dominates in the visible range, while Mie scattering (scattering by large particles) prevails in the near-infrared [19]. Thereby, for the visible range, only the Rayleigh scattering component is often used, while for the near-infrared range the scattering spectrum is either assumed constant or weakly depends on wavelength.
When implementing DOS using broadband radiation and a spectrometer, it is preferable to use as wide a spectrum range as possible to account for more chromophores. The inclusion of more absorption peaks from different chromophores within the measured spectrum enhances the accuracy of concentration determination. In practice, the spectral range of DOS studies is usually limited to 450–1000 nm. In the short-wavelength range, the limitation is due to the high absorption of chromophores such as melanin and hemoglobin, while the long-wavelength range is limited by the sensitivity of silicon detectors. For registration in the NIR-II range, spectrometers with a different type of matrix, such as InGaAs, are used. Although more expensive, these systems provide more reliable data on lipid and water concentrations [35].
Thus, the inverse problem of DOS — the reconstruction of chromophore concentrations Ci from the measured diffuse spectrum — can be solved simultaneously with determining the scattering spectrum parameters a, f, b, included in equation (3) [36]. This approach is the simplest method for estimating the concentrations of minor chromophores over a wide wavelength range (visible to near-infrared). While the use of SFDI technique can improve measurement accuracy by independently estimating µa and µ’s at different wavelengths, but this method is more technically demanding.
Chromophores of biological tissues
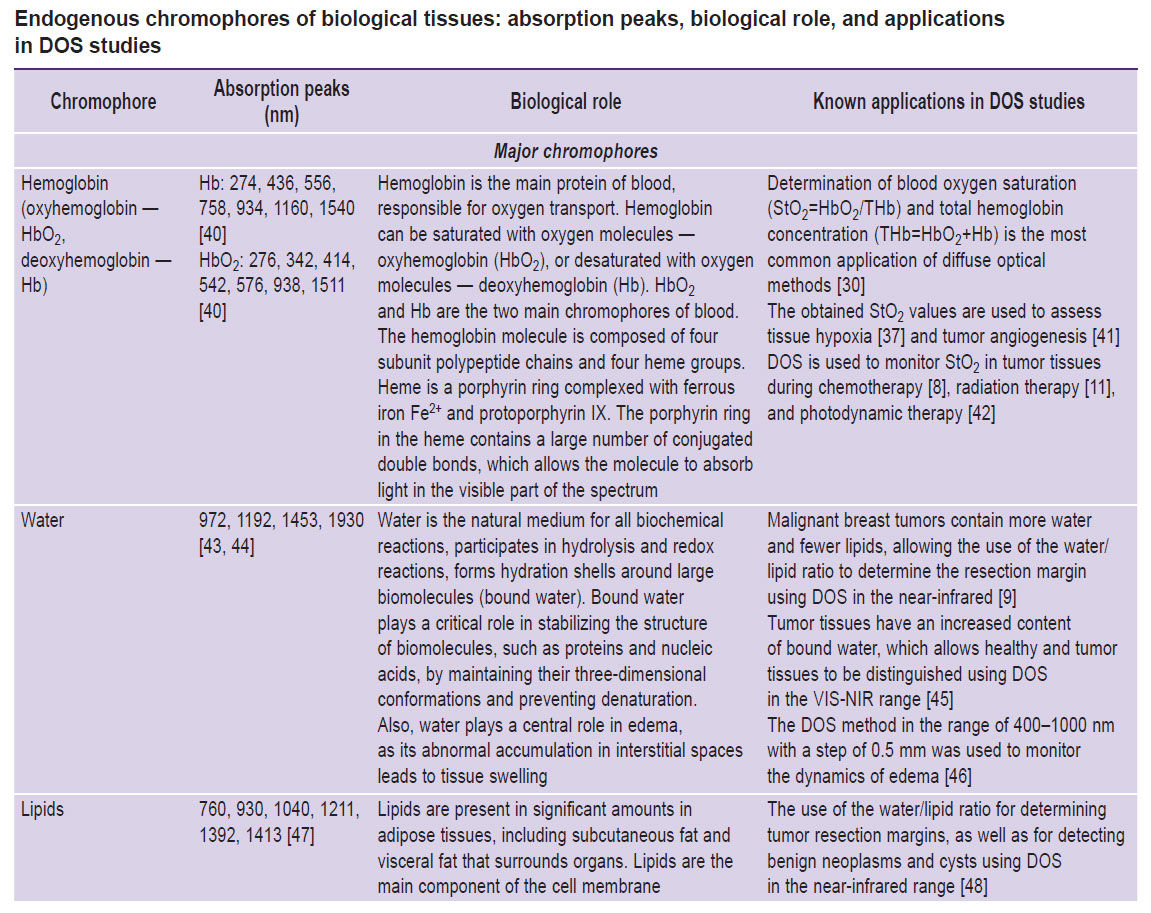
There are many different light-absorbing chromophores in human and animal tissues [37–70]. The most studied include deoxygenated and oxygenated hemoglobin, water, and lipids [37, 38]. In the visible and near-infrared wavelength ranges, where DOS measurements are typically conducted, these chromophores contribute the most to light absorption (2), and, accordingly, are well detected by DOS (see the Table).
|
Endogenous chromophores of biological tissues: absorption peaks, biological role, and applications in DOS studies |
The absorption of DNA and most polypeptides are predominantly in the ultraviolet (UV) spectral range. In particular, aromatic amino acids — tryptophan, tyrosine, and phenylalanine — absorb in the UV-range, resulting in most proteins absorbing light at a wavelength of 280 nm [39]. Thus, DNA and polypeptides don’t contribute significantly to absorption in the visible and near-infrared ranges and are not detectable by DOS within these spectral regions.
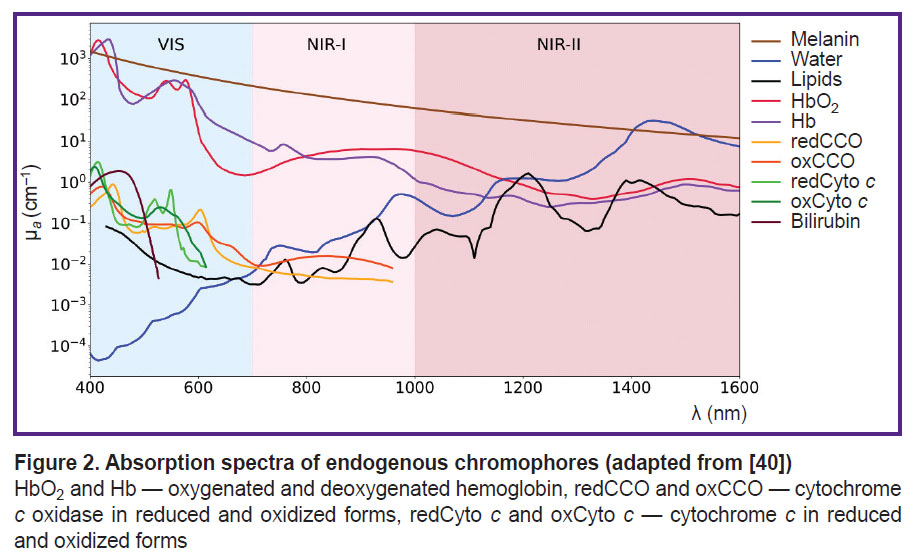
In Figure 2 the spectra of major chromophores, HbO2, Hb, water, melanin, lipids, and some minor chromophores, cytochrome c oxidase, cytochrome c, bilirubin, are presented. As shown in the figure, the absorption spectra of these chromophores exhibit distinct features, enabling the potential quantification of their concentrations based on the DOS measurements [13].
|
Figure 2. Absorption spectra of endogenous chromophores (adapted from [40]) HbO2and Hb — oxygenated and deoxygenated hemoglobin, redCCO and oxCCO — cytochromecoxidase in reduced and oxidized forms, redCytocand oxCytoc—cytochromecin reduced and oxidized forms |
Major chromophores of biological tissues
Water. Water is one of the most abundant biological compound in the human body, playing a vital role in hydrolysis and redox reactions. It constitutes 60 to 80% of a living cell’s mass and is one of the primary chromophores in biological tissues. While the absorption coefficient of water is insignificant in the visible wavelength range, exhibits several absorption peaks in the near-infrared range [7] (see Figure 2). The water/lipid ratio in breast cancer tissue can provide important information about tumor structure. For instance, studies have shown that malignant breast tumors exhibit higher water content and lower lipid levels compared to normal tissue [71]. In the study by Veluponnar et al. [9], it was shown that absorption in the near-infrared region, related to the fat/water ratio in tissue, allows the use of DOS to assess the resection margin during breast cancer surgery.
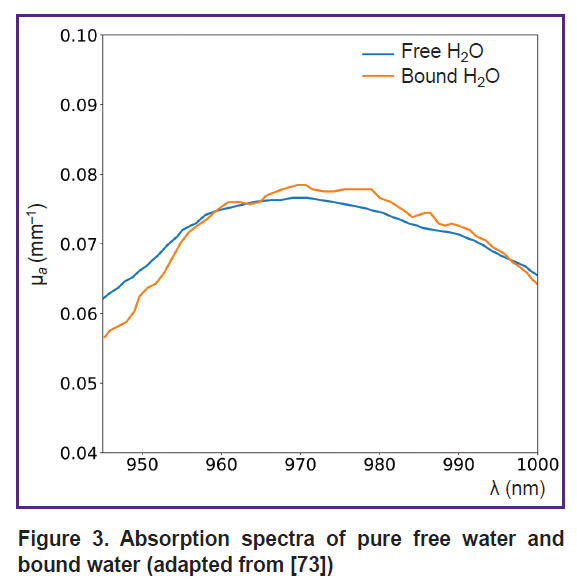
Another application of DOS is the assessment of bound and free water fractions in tissues. Bound water, which forms hydration shells around biopolymers through electrostatic interactions [72], is essential for stabilizing intracellular macromolecules and membranes, as well as facilitating the diffusion of substances across membranes. The fraction of bound water introduces small changes in the shape of the water absorption spectrum within tissues (Figure 3), shifting the water absorption maximum by several nanometers [73]. This property has been exploited to distinguish malignant breast cancer tissues from normal tissues. For instance, Chung et al. [45] demonstrated by employing DOS in the visible to near-infrared (VIS-NIR) range, that breast tumor tissues contain significantly higher levels of bound water compared to healthy tissue.
|
Figure 3. Absorption spectra of pure free water and bound water(adapted from [73]) |
Lipids. In the human body, lipids are present in significant amounts within adipose tissues, including subcutaneous fat (located beneath the skin) and visceral fat (surrounding internal organs). For example, a dense layer of adipose tissue surrounds the breast. Additionally, lipids are the main component of the cell membrane. Like water, lipids are major absorbing chromophores in the near-infrared wavelength range [74]. The presence of lipids in a sample is characterized by a narrow absorption peak around 1211 nm [47] (see Figure 2).
Tissues with a high content of membrane organelles in cells (mitochondria, lysosomes) exhibit pronounced Rayleigh scattering due to the high density of lipid membranes, causing b and f in equation (3) to increase [75, 76].
The water/lipid ratio in breast tissues can be used not only for monitoring and resection of malignant tumors but also for detecting benign neoplasms and cysts [48].
It is important to note that the properties and functions of lipids directly depend on the fatty acids they contain. In turn, fatty acids differ in chain length and the presence of double bonds in their structure. Saturated, monounsaturated, and polyunsaturated fatty acids are distinguished. Typically, the subcutaneous adipose tissue of an adult human contains 21, 46, and 33% saturated, monounsaturated, and polyunsaturated fatty acids, respectively. Variations in this ratio lead to small changes in the lipid absorption spectrum. For example, a sample consisting of 42, 46, and 12% saturated, monounsaturated, and polyunsaturated fatty acids, respectively, shows an additional absorption peak at 1170 nm [47].
For confident separation of lipids and water, it is preferable to use the NIR-II spectral range, where the absorption peaks of water and lipids are well-separated (see Figure 2). In the NIR-I range, the absorption peaks of lipids (930 nm) and water (975 nm) overlap significantly, making their separation challenging [77, 78].
Melanin. Melanin is an endogenous pigment, an insoluble high-molecular-weight polymer responsible for the coloration of eyes, hair, and skin. It is produced by melanocytes through a process called melanogenesis in cytoplasmic organelles known as melanosomes. In the epidermis, melanocytes transport melanosomes to keratinocytes through dendritic processes [79]. Melanin plays a crucial role in skin homeostasis, protecting tissues from UV radiation by absorbing and dissipating UV light in the range of 320 to 400 nm [80]. Melanin exists in different forms, such as eumelanin (brown/black) and pheomelanin (red/yellow), contributing to the diversity of pigmentation in humans and other organisms.
Quantitative determination of melanin using non-invasive methods is important for clinical studies. Abnormal level of melanin is an indicator of various diseases. In particular, objective measurements of melanin content in tissues can aid in differentiating melanoma from benign pigmented neoplasms, as well as for assessing pigmented diseases and monitoring therapeutic responses [81].
Several studies demonstrated the use of DOS method for the in vivo quantitative assessment of melanin content in tissues for melanoma diagnosis [50–52]. For instance, DOS showed that eumelanin content increases during the progression from dysplastic nevus to invasive melanoma, while pheomelanin content decreases [51].
It is important to note that the absorption spectrum of melanin exhibits a monotonic decrease as wavelength increases, similar to the behavior of the transport scattering coefficient. This similarity complicates the reconstruction of melanin concentration in DOS systems that do not employ hardware-based separation of scattering and absorption coefficients.
Hemoglobin. Hemoglobin is a complex protein composed of four polypeptide chains, each associated with a heme group. The porphyrin ring in the heme group contains an extensive system of conjugated double bonds, which gives it the ability to absorb light in the visible part of the spectrum. The protein component of the molecule, globin, consists of two α- and two β-subunits. The heme, a complex of protoporphyrin IX with an iron atom Fe2+. These iron atoms in the Fe2+ state can bind to oxygen [82].
Hemoglobin exists in two primary states based on its oxygen binding: oxyhemoglobin (HbO2), which is saturated with oxygen molecules, and deoxyhemoglobin (Hb), which is unsaturated and lacks bound oxygen. HbO2 and Hb are the major chromophores of blood, with their absorption spectra shown in Figure 2. Determination of blood oxygenation is the most common application of optical diffusion methods. For example, pulse oximetry assesses arterial blood oxygenation by exploiting differences in absorption spectra in the visible range (500–600 nm) in reflective configuration (e.g., fitness bracelets and smartwatches), and in the near-infrared range (700–900 nm) in pulse oximeters with transmission or reflective configurations [83]. In contrast to pulse oximetry, DOS delivers average tissue oxygenation values [30, 84–86], which differ fundamentally from the measurements acquired through pulse oximetry.
Hemoglobin (Hb) and oxyhemoglobin (HbO2) are of significant interest in clinical research because they provide critical information about total hemoglobin concentration (THb=HbO2+Hb) and blood oxygenation level (StO2=HbO2/THb) [30]. Experimentally measured StO2 values are utilized to evaluate tissue hypoxia [37] and study tumor angiogenesis [41]. Hypoxia causes tumor resistance to standard therapy and promotes the development of an aggressive phenotype [87]. Therefore, timely assessment of tumor oxygenation can play a crucial role in optimizing and adjusting treatment strategies. The use of DOS for monitoring tumor tissue oxygenation has been demonstrated during chemotherapy [8], radiation therapy [11], and photodynamic therapy [42].
Minor chromophores of biological tissues
In addition to the major forms of hemoglobin, human blood contains derivatives (MetHb, HbCO, ect.). Monitoring these derivative forms is crucial for studying various pathologies, such as toxic exposures, metabolic disorders, and conditions affecting oxygen transport [88]. It is important to note that the absorption spectra of different forms of hemoglobin, can vary significantly [56, 89, 90]. These distinct spectral features enable their differentiation and quantification using DOS (Figure 4).
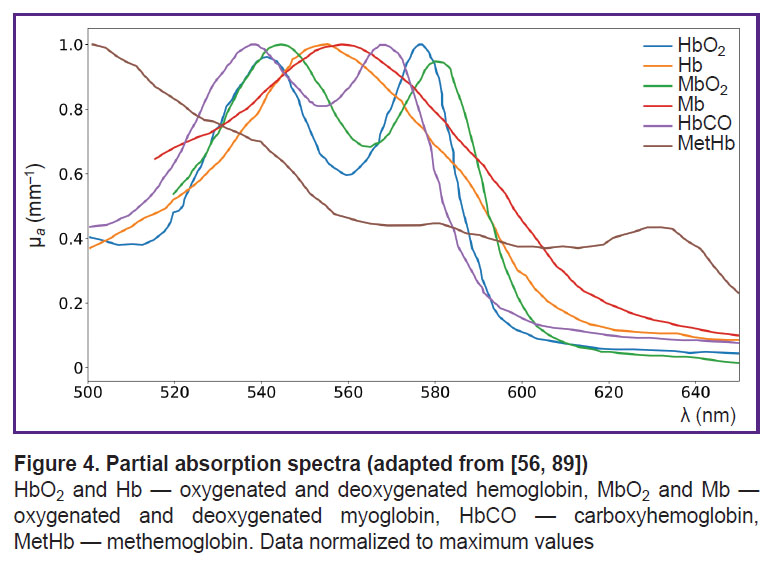 |
Figure 4. Partial absorption spectra (adapted from [56, 89]) HbO2and Hb — oxygenated and deoxygenated hemoglobin, MbO2and Mb — oxygenated and deoxygenated myoglobin, HbCO— carboxyhemoglobin, MetHb — methemoglobin. Data normalized to maximum values |
Carboxyhemoglobin. Carboxyhemoglobin (HbCO) is formed when hemoglobin binds to carbon monoxide (CO) instead of oxygen, reducing its oxygen-carrying capacity. The level of HbCO increases with CO exposure, as CO has 200–300 times greater affinity for hemoglobin than oxygen [91]. The HbCO content in the blood is an important physiological indicator in carbon monoxide poisoning. Additionally, early studies using electrocardiography noted that the presence of CO in inhaled air during physical activity can have adverse effects on patients with cardiovascular diseases, even at low concentrations [92]. Therefore, monitoring HbCO concentration in tissues may be of interest in clinical studies.
The absorption spectrum of HbCO is not well characterized, with only two peaks in the visible range, close to the absorption peaks of HbO2 and MbO2 [56] (see Figure 4), complicating HbCO reconstruction using DOS.
Carbaminohemoglobin. Carbaminohemoglobin (also known as carbhemoglobin) (HbCO2) is a form of hemoglobin that binds to carbon dioxide (CO2) for transport from tissues to the lungs, where it is exhaled. Unlike HbO2, which carries oxygen, HbCO2 forms when CO2 binds to the amino groups of the globin chains (not the heme iron). Dervieux et al. [93] isolated HbCO2 and Hb from human blood and measured their absorption spectra in two ranges — 235–600 nm and 600–1000 nm. The results showed that the absorption spectra of HbCO2 and Hb are very close and practically overlap. Therefore, it is difficult to determine HbCO2 concentration in tissues using non-invasive optical methods.
Methemoglobin. Methemoglobin (MetHb) is an oxidized form of hemoglobin in which the iron in the heme group is in the ferric Fe3+ state instead of the normal ferrous Fe2+ state. The enzyme cytochrome b5 reductase (also known as NADH-cytochrome b5 reductase) plays a critical role in reducing MetHb back to its functional form, Hb, by converting the ferric iron Fe3+ in MetHb to Fe2+. Under normal physiological conditions, the concentration of MetHb in human blood is very low, typically around 1–2% of total hemoglobin.
MetHb cannot bind oxygen and, as a result, it is incapable of transporting oxygen to tissues. Elevated levels of MetHb reduce the overall oxygen-carrying capacity of the blood, leading to tissue hypoxia and symptoms such as cyanosis (bluish discoloration of the skin) and shortness of breath, despite a possible normal level of total hemoglobin [61, 62]. MetHb levels are traditionally assessed using biochemical methods, such as high-performance liquid chromatography or electrophoresis [94]. Elevated MetHb levels have been found in patients with sepsis, infants with severe metabolic acidosis (blue baby syndrome), and individuals with rare congenital metabolic abnormalities, such as glucose-6-phosphate dehydrogenase deficiency [95].
Since the nitrite ion NO2– oxidizes Fe2+ to Fe3+, MetHb formation in the body can occur as a result of nitrate poisoning and acquired methemoglobinemia. It has been noted that methemoglobinemia can be acquired through exposure to various drugs (such as benzocaine, dapsone, sulfonamides, and nitrate derivatives) or other chemical compounds that are strong oxidizers [61]. Therefore, MetHb content in biological tissue is an important clinical indicator.
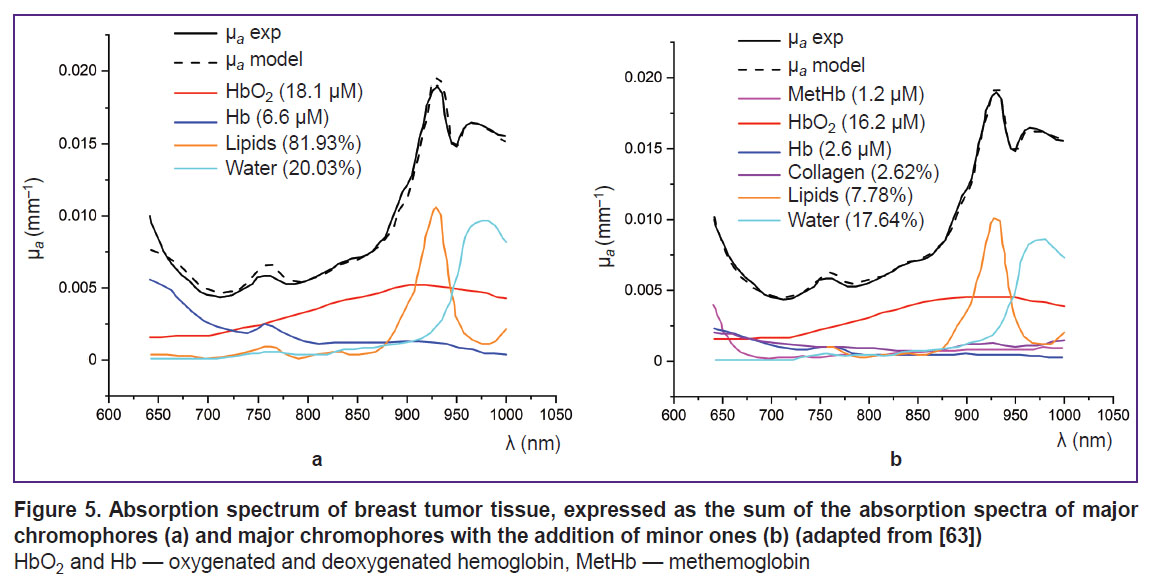
MetHb has an absorption peak of about 630 nm, making it noticeable against other globins [95] (see Figure 4). In the study using DOS in the NIR range (640–1000 nm), Vasudevan et al. [63] demonstrated that including MetHb in the tissue chromophore absorption spectrum — alongside HbO2, Hb, water, lipids, and collagen — significantly reduced the discrepancy between the modeled and experimentally measured absorption spectra (Figure 5). Additionally, this study found that MetHb concentration in tumor tissues is higher than in normal breast tissues. Since MetHb concentration in healthy tissues is extremely low, it can serve as a potential oncological marker.
|
Figure 5. Absorption spectrum of breast tumor tissue, expressed as the sum of the absorption spectra of major chromophores (a) and major chromophores with the addition of minor ones (b) (adapted from [63]) HbO2 and Hb — oxygenated and deoxygenated hemoglobin, MetHb — methemoglobin |
Another application of DOS is the monitoring of burn wounds. Using DOS in the VIS-NIR range (400–1000 nm) with a 10 nm resolution, researchers observed an increase in MetHb levels associated with changes in skin hemodynamics during burn injuries [14]. In this study, Khatun et al. [96] developed a method for the joint quantitative assessment of melanin, HbO2, Hb, and MetHb in rat tissue models with methemoglobinemia. This method was then applied to classify burns by severity and assess burn depth in rats.
Myoglobin. Myoglobin is a small, oxygen-binding protein primarily found in muscle tissues, where it plays a key role in oxygen storage and diffusion to mitochondria for cellular respiration. Structurally, myoglobin consists of a single polypeptide chain and a heme group. Its primary function is to reversibly bind oxygen and facilitate oxygen diffusion from blood capillaries into muscle mitochondria [97]. Additionally, myoglobin serves as a biomarker for muscle damage, as its release into the bloodstream is indicative of conditions such as rhabdomyolysis or myocardial infarction. A major focus in preclinical and clinical studies of myoglobin is the quantitative assessment of myoglobin oxygen saturation (sO2-Mb) [98].
In the study using DOS in the VIS-NIR range (540–800 nm), Arakaki et al. [65] introduced a muscle oxygenation index, which represents the percentage of oxygenated myoglobin and hemoglobin relative to the total amount of myoglobin and hemoglobin in the tissue. The results demonstrated that measuring the oxygenation of both hemoglobin and myoglobin together provides a more accurate assessment of muscle oxygenation compared to measuring only arterial components (Figure 6).
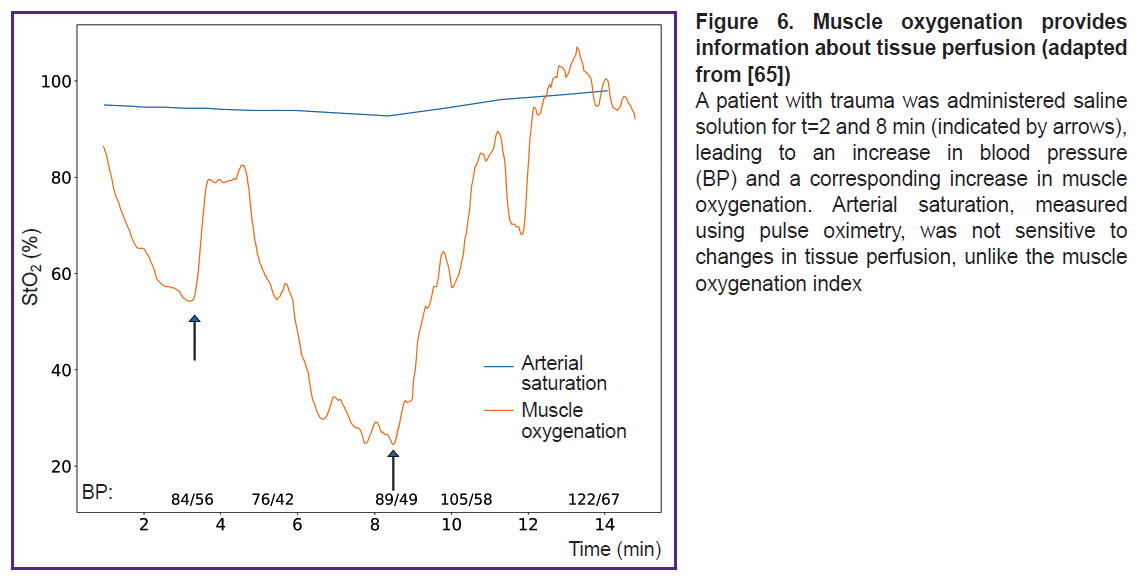 |
Figure 6. Muscle oxygenation provides information about tissue perfusion (adapted from [65]) A patient with trauma was administered saline solution for t=2 and 8 min (indicated by arrows), leading to an increase in blood pressure (BP) and a corresponding increase in muscle oxygenation. Arterial saturation, measured using pulse oximetry, was not sensitive to changes in tissue perfusion, unlike the muscle oxygenation index |
Metmyoglobin. Metmyoglobin is the oxidized form of myoglobin. In living muscle tissue, the concentration of metmyoglobin is extremely low due to the activity of the enzyme metmyoglobin reductase. This enzyme, in the presence of the cofactor NADH and the coenzyme cytochrome b5, reduces the ferric iron (Fe3+) in the heme group of metmyoglobin back to ferrous iron Fe2+ restoring it to functional myoglobin. This reduction process is essential for maintaining the oxygen-binding capacity of myoglobin and ensuring efficient oxygen storage and diffusion in muscle tissues.
In meat science, the accumulation of metmyoglobin is associated with the browning of meat, as it alters the pigment’s color from red to brown [99]. To extend the shelf life of the meat product, it is extremely important to detect the formation and accumulation of metmyoglobin, as well as to measure meat oxygenation. Like methemoglobin, metmyoglobin has a distinct absorption spectrum, which allows its detection and quantification using spectroscopic techniques. In particular, DOS was used to assess the ratio of metmyoglobin and oxygenation in pork and beef [15].
Bilirubin. Heme is released when red blood cells reach the end of their lifespan and are broken down in the spleen. The enzyme heme oxygenase then catalyzes the conversion of heme into biliverdin, a green pigment. This reaction also produces a free iron ion Fe3+ and CO as byproducts. Biliverdin consists of four pyrrole rings connected in a linear chain. Biliverdin is then further reduced to free (unconjugated) bilirubin by the enzyme biliverdin reductase. Free bilirubin is poorly soluble in water and is transported by the bloodstream as a complex with the plasma protein albumin [39]. Each albumin molecule can bind two bilirubin molecules. With the bloodstream, unconjugated bilirubin is transported to the liver where it undergoes further metabolism in hepatocytes. Here, it is conjugated with glucuronic acid by the enzyme UDP-glucuronosyltransferase, forming bilirubin diglucuronide (also known as conjugated bilirubin). This conjugated form is water-soluble and insolubility in fats, unlike its unconjugated counterpart, and is excreted as a key component of bile into the small intestine [100].
Under conditions of increased hemolysis of red blood cells, impaired liver function, or blockage of the bile ducts, the level of bilirubin in the blood rises. Bilirubin acts as an antioxidant in mammalian tissues, helping to neutralize reactive oxygen species and protect cells from oxidative damage. However, when the concentration of bilirubin in the serum exceeds the binding capacity of serum albumin, it can lead to bilirubin intoxication. This condition results in the accumulation of free, unbound bilirubin in the blood, causing hyperbilirubinemia and potentially leading to jaundice, characterized by yellowing of the skin and eyes [100]. In most infants, hyperbilirubinemia is a normal and temporary condition, commonly referred to as physiological jaundice. However, in some infants, particularly premature babies, hyperbilirubinemia can result in the accumulation of bilirubin in brain tissue when high levels of unbound bilirubin cross the blood-brain barrier, leading to a condition known as kernicterus [101]. Therefore, it is recommended to carefully monitor bilirubin levels in serum during neonatal jaundice, especially in the first 24 h [102].
Thus, bilirubin is an important chromophore for assessing health status in neonatal jaundice, liver cirrhosis, and hepatitis. Traditionally, the levels of various forms of bilirubin in the blood are assessed using invasive biochemical methods. These methods involve drawing a blood sample and analyzing the serum to quantify bilirubin concentrations. Non-invasive alternatives, such as transcutaneous bilirubinometry or optical spectroscopy, are increasingly being explored to provide real-time, painless assessments of bilirubin levels [55].
The absorption maximum of bilirubin lies within the range of 400–500 nm (see Figure 2). In the study by Banerjee et al. [55], DOS in the range of 400–700 nm was employed to measure bilirubin content, HbO2, Hb, and blood oxygenation in 4668 newborns with ages ranging from 28 to 40 weeks. Similar indicators were measured using invasive biochemical methods. The values obtained by the two different methods had a high degree of correlation. In particular, for bilirubin r=0.88.
Another application of DOS is the monitoring of malignant tumors. Nachabé et al. [43] studied the absorption coefficient of bile in healthy and tumor tissues of the liver using DOS. The study used a setup with two spectrometers, covering the ranges of 400–1100 nm and 800–1700 nm. The light scattering model included major chromophores such as water, lipids, HbO2, and Hb. The results showed that including bile in the reconstruction model significantly reduced the discrepancy between the model and measured absorption spectra of healthy liver tissues. Additionally, the authors found that tumor tissues of the liver contain approximately five times less bile than healthy tissues, allowing the use of non-invasive methods for classifying healthy and cancerous tissues during ablation.
Cytochromes and cytochrome oxidase. As mentioned earlier, the concentrations of HbO2 and Hb allow for the assessment of blood filling and tissue oxygenation, while the registration of cytochromes and cytochrome oxidase allows for the monitoring of oxidative metabolism in tissue mitochondria [103].
Cytochromes are proteins with an iron-containing prosthetic group known as heme. The heme group features a system of conjugated double bonds, giving cytochromes their characteristic absorption peaks in the visible spectrum. Mitochondria contain three classes of cytochromes: a, b, and c, each with distinct absorption spectrum. For example, the absorption peak of cytochrome a is shifted to the long-wavelength region around 600 nm, cytochrome b around 560 nm, and cytochrome c around 550 nm [39].
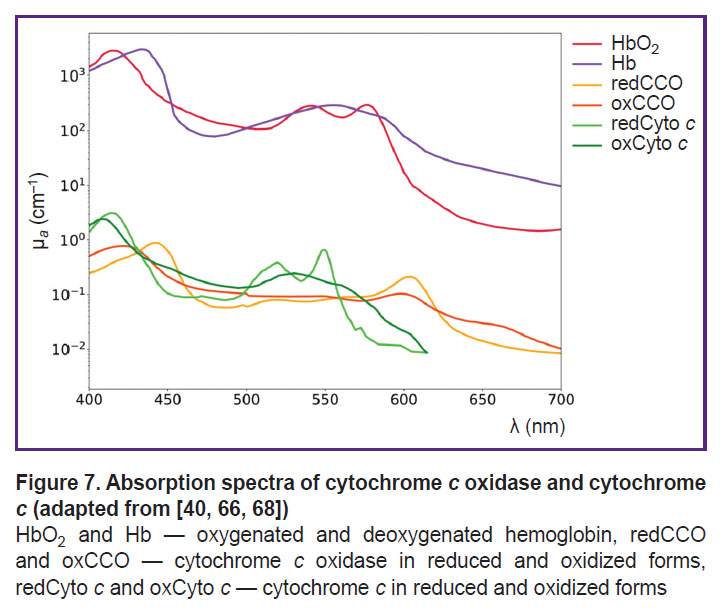
Cytochrome c is a crucial component of the mitochondrial respiratory chain, playing a key role in electron transport during cellular respiration. Its ability to alternate between oxidized (oxCyto c) and reduced (redCyto c) states makes it a dynamic indicator of mitochondrial oxygenation levels [37]. In the study [104], it was demonstrated that the absorption spectra of oxidized cytochrome c (oxCyto c) and reduced cytochrome c (redCyto c) measured in pig heart tissues are distinct (Figure 7). Studies of cytochrome c using DOS are not widely covered in the literature due to the overlap of cytochrome and hemoglobin absorption spectra. However, an in vivo DOS study on pig heart identified an optical “window” from 540 to 585 nm, allowing for the detection of myoglobin and cytochrome c with minimal interference from HbO2 and Hb [67].
|
Figure 7. Absorption spectra of cytochromecoxidase and cytochromec(adapted from [40, 66, 68])
HbO2and Hb — oxygenated and deoxygenated hemoglobin, redCCO andoxCCO — cytochromecoxidase in reduced and oxidized forms, redCytocandoxCytoc—cytochromecin reducedand oxidized forms |
Among the components of the mitochondrial respiratory chain, cytochrome c oxidase has received the most attention in DOS studies. For example, including cytochrome c oxidase in the light propagation model in tissues improved the reconstruction quality of other chromophores [69].
Cytochrome c oxidase, also known as complex IV, is a key enzyme in the mitochondrial electron transport chain and belongs to the group of oxidoreductases. The complex is localized in the inner mitochondrial membrane and functions as a homodimer, with each monomer consisting of 13 subunits. Subunit I contains two heme groups: heme a and heme a3, as well as a copper ion CuB. Heme a3 and CuB form a binuclear Fe–Cu center, which plays a critical role in the enzyme’s function. This center receives electrons from heme a and transfers them to molecular oxygen bound at the active site of heme a3. Subunit II contains two copper ions, which are bound to two cysteine residues via –SH groups, also forming a binuclear center CuA.
Each of these centers can exist in oxidized or reduced states and has different absorption spectra. Despite the fact that the dominant chromophore in the near-infrared range is the CuA, center, other redox centers of cytochrome can also contribute to the formation of the resulting absorption spectrum of cytochrome c oxidase [104]. For example, it has been established that the fully oxidized binuclear center a3/CuB demonstrates an absorption peak at 655 nm.
Cytochrome c oxidase catalyzes the transfer of electrons from cytochrome c to molecular oxygen, reducing oxygen to water [105]. Simultaneous monitoring of the redox state of cytochrome c oxidase (oxCCO/redCCO) and hemoglobin can provide additional information on hemodynamics, oxygenation, and tissue metabolism [104]. Using DOS in the range of 650 to 100 nm, Lee et al. [70] conducted joint registration of total hemoglobin, HbO2, and Hb, as well as oxCCO and redCCO in muscle tissues of model animals during cyanide poisoning. The results demonstrated that an optical window ranging approximately from 540 to 585 nm was identified in the pig heart in vivo, enabling the monitoring of myoglobin and cytochrome c without interference from hemoglobin oxygenation or blood volume variations.
It has also been shown that monitoring cytochrome c oxidase using DOS in the near-infrared correlates with other metabolic indicators, obtained through magnetic resonance spectroscopy or invasive methods, such as cerebral microdialysis [106, 107]. In particular, Tisdall et al. [106] studied the effect of hyperbaric oxygen therapy after traumatic brain injury (TBI). Since TBI is accompanied by impaired aerobic metabolism and mitochondrial dysfunction, the study monitored the concentration of oxidized cytochrome c oxidase using DOS in the near-infrared range (650 and 980 nm). The results showed that changes in oxCCO concentration correlated with changes in brain tissue oxygenation (r=0.57, p=0.005).
One of the most interesting applications of DOS may be the joint registration of major and several minor chromophores. It has been established that the muscle-specific oxygen-binding protein, myoglobin, localized in mitochondria, interacts with complex IV of the respiratory chain. This suggests that myoglobin may be a factor regulating mitochondrial respiration [108].
The joint registration of myoglobin, HbO2, oxygen saturation, and cytochrome c oxidase using DOS in vivo offers a comprehensive understanding of the physiological state of biological tissues. Arakaki et al. [109] determined the absorption spectra of heme aa3 of cytochrome c oxidase, HbO2 and Hb, as well as MbO2 and Mb in the range of 600–850 nm in vitro. Then they applied the DOS method for simultaneous monitoring of major chromophores with cytochrome c oxidase and other minor chromophores in an in vivo experiment on rabbit forelimb muscle during ischemia. The study focused on the absorption spectrum of heme aa3 cytochrome c oxidase. Assessment of the redox status of heme aa3, as well as oxygenation of hemoglobin and myoglobin in vivo was also conducted in the range of 600–850 nm. The results showed that during ischemia of the rabbit forelimb, hemoglobin desaturation occurs first, followed by myoglobin, and finally, the reduction of heme aa3. To solve the problem of overlapping spectra of the studied chromophores, the authors used the second derivative of the in vitro absorption spectrum obtained in the experiment, which provided better-defined absorption peaks for Hb, Mb, oxССOaa3, and redCCOaa3 compared to original spectra.
Conclusion
The presence of light-absorbing compounds, known as chromophores, in biological tissues enables widespread use of DOS for the diagnosis and monitoring of various pathologies. Among the major chromophores of biological tissues are water, lipids, melanin, oxy- and deoxyhemoglobin. Monitoring the water content in tissues can help detect edema, while the lipid/water ratio in tumors can assist in determining resection margins. Monitoring oxy- and deoxyhemoglobin allows to determine the degree of tissue oxygenation, detect hypoxia, and evaluate the effectiveness of antitumor therapy, among other applications. Additionally, melanin content in tissue serves as an important criterion for diagnosing melanoma stages.
In addition to major chromophores, biological tissues contain minor ones, such as bilirubin, various globins (carboxyhemoglobin, methemoglobin, myoglobin, etc.), as well as cytochromes and cytochrome c oxidase. Comprehensive study of major and minor tissue chromophores allows for simultaneous monitoring of metabolic processes in vascular, intracellular, and mitochondrial compartments. This approach is not only valuable in physiological studies of tissue metabolism but also for clinical applications, particularly in cases where oxygen supply to tissues is impaired. For example, assessment of the redox status of cytochrome c oxidase for monitoring therapy after traumatic brain injury, monitoring methemoglobin for assessing burn depth in vivo, assessment of myoglobin oxygenation in tissues for monitoring muscle metabolism after injury, and a number of other, currently not considered in the literature, applications. Furthermore, incorporating minor chromophores in the light scattering model in tissues improves the accuracy of reconstructing the concentrations of other chromophores from the signal recorded by DOS.
Authors’ contributions: K.A. Bylinskaya — material collection, text writing, preparation of illustrations; V.V. Perekatova — editing, preparation of illustrations; I.V. Turchin — material collection, text writing, editing, responsibility for the integrity of all parts of the article, approval of the final version of the article.
Research funding. Supported by the Center of Excellence “Center of Photonics” funded by the Ministry of Science and Higher Education of the Russian Federation, contract No.075-15-2022-316.
Conflicts of interests. The authors have no conflicts of interest to declare.
References
- Movasaghi Z., Rehman S., Rehman I.U. Raman spectroscopy of biological tissues. Appl Spectrosc Rev 2007; 42(5): 493–541, https://doi.org/10.1080/05704920701551530.
- Xie S., Li H., Zheng W., Chia T.-C., Lee S., Huang Z. Principles and techniques for measuring optical parameters of biotissue. Lasers in medicine and dentistry: diagnostics and treatment 1996; 2887: 92–102, https://doi.org/10.1117/12.251937.
- Hoshi Y., Yamada Y. Overview of diffuse optical tomography and its clinical applications. J Biomed Opt 2016; 21(9): 091312, https://doi.org/10.1117/1.JBO.21.9.091312.
- Potapova E.V., Shupletsov V.V., Dremin V.V., Zherebtsov E.A., Mamoshin A.V., Dunaev A.V. In vivo time-resolved fluorescence detection of liver cancer supported by machine learning. Lasers Surg Med 2024; 56(10): 836–844, https://doi.org/10.1002/lsm.23861.
- Fritsch C., Ruzicka T. Fluorescence diagnosis and photodynamic therapy in dermatology from experimental state to clinic standard methods. J Environ Pathol Toxicol Oncol 2006; 25(1–2): 425–439, https://doi.org/10.1615/jenvironpatholtoxicoloncol.v25.i1-2.270.
- Khilov A.V., Sergeeva E.A., Kurakina D.A., Turchin I.V., Kirillin M.Yu. Analytical model of fluorescence intensity for the estimation of fluorophore localisation in biotissue with dual-wavelength fluorescence imaging. Quantum Electronics 2021; 51(2): 95–103, https://doi.org/10.1070/qel17503.
- de Boer L.L., Molenkamp B.G., Bydlon T.M., Hendriks B.H., Wesseling J., Sterenborg H.J., Ruers T.J. Fat/water ratios measured with diffuse reflectance spectroscopy to detect breast tumor boundaries. Breast Cancer Res Treat 2015; 152(3): 509–518, https://doi.org/10.1007/s10549-015-3487-z.
- Druzhkova I., Bylinskaya K., Plekhanov A., Kostyuk A., Kirillin M., Perekatova V., Khilov A., Orlova A., Polozova A., Komarova A., Lisitsa U., Sirotkina M., Shirmanova M., Turchin I. Effects of FOLFOX chemotherapy on tumor oxygenation and perfused vasculature: an in vivo study by optical techniques. J Biophotonics 2024, https://doi.org/10.1002/jbio.202400339.
- Veluponnar D., de Boer L.L., Dashtbozorg B., Jong L.S., Geldof F., Guimaraes M.D.S., Sterenborg H.J.C.M., Vrancken-Peeters M.T.F.D., van Duijnhoven F., Ruers T. Margin assessment during breast conserving surgery using diffuse reflectance spectroscopy. J Biomed Opt 2024; 29(4): 045006, https://doi.org/10.1117/1.JBO.29.4.045006.
- Skyrman S., Burström G., Lai M., Manni F., Hendriks B., Frostell A., Edström E., Persson O., Elmi-Terander A. Diffuse reflectance spectroscopy sensor to differentiate between glial tumor and healthy brain tissue: a proof-of-concept study. Biomed Opt Express 2022; 13(12): 6470–6483, https://doi.org/10.1364/BOE.474344.
- Jules A., Means D., Troncoso J.R., Fernandes A., Dadgar S., Siegel E.R., Rajaram N. Diffuse reflectance spectroscopy of changes in tumor microenvironment in response to different doses of radiation. Radiat Res 2022; 198(6): 545–552, https://doi.org/10.1667/RADE-21-00228.1.
- Hsu C.K., Tzeng S.Y., Yang C.C., Lee J.Y., Huang L.L., Chen W.R., Hughes M., Chen Y.W., Liao Y.K., Tseng S.H. Non-invasive evaluation of therapeutic response in keloid scar using diffuse reflectance spectroscopy. Biomed Opt Express 2015; 6(2): 390–404, https://doi.org/10.1364/BOE.6.000390.
- Schelkanova I., Pandya A., Muhaseen A., Saiko G., Douplik A. Early optical diagnosis of pressure ulcers. In: Meglinski I. (editor). Biophotonics for medical applications. Woodhead Publishing; 2015; p. 347–375, https://doi.org/10.1016/B978-0-85709-662-3.00013-0.
- Parvez M.A., Yashiro K., Nagahama Y., Tsunoi Y., Saitoh D., Sato S., Nishidate I. In vivo visualization of burn depth in skin tissue of rats using hemoglobin parameters estimated by diffuse reflectance spectral imaging. J Biomed Opt 2024; 29(2): 026003, https://doi.org/10.1117/1.JBO.29.2.026003.
- Nguyen T., Kim S., Kim J.G. Diffuse reflectance spectroscopy to quantify the met-myoglobin proportion and meat oxygenation inside of pork and beef. Food Chem 2019; 275: 369–376, https://doi.org/10.1016/j.foodchem.2018.09.121.
- Rossel R.A.V., Behrens T., Ben-Dor E., Chabrillat S., Demattê J.A.M., Ge Y., Gomez C., Guerrero C., Peng Y., Ramirez-Lopez L., Shi Z., Stenberg B., Webster R., Winowiecki L., Shen Z. Diffuse reflectance spectroscopy for estimating soil properties: a technology for the 21st century. European Journal of Soil Science 2022; 73(4): e13271, https://doi.org/10.1111/ejss.13271.
- Beschastnov V.V., Ryabkov М.G., Pavlenko I.V., Bagryantsev М.V., Dezortsev I.L., Kichin V.V., Baleyev М.S., Maslennikova А.V., Orlova А.G., Kleshnin М.S., Turchin I.V. Current methods for the assessment of oxygen status and biotissue microcirculation condition: diffuse optical spectroscopy (review). Sovremennye tehnologii v medicine 2018; 10(4): 183, https://doi.org/10.17691/stm2018.10.4.22.
- Turchin I.V. Methods of biomedical optical imaging: from subcellular structures to tissues and organs. Physics-Uspekhi 2016; 59(5): 487–501, https://doi.org/10.3367/ufne.2015.12.037734.
- Perekatova V., Kostyuk A., Kirillin M., Sergeeva E., Kurakina D., Shemagina O., Orlova A., Khilov A., Turchin I. VIS-NIR diffuse reflectance spectroscopy system with self-calibrating fiber-optic probe: study of perturbation resistance. Diagnostics (Basel) 2023; 13(3): 457, https://doi.org/10.3390/diagnostics13030457.
- Budylin G.S., Davydov D.A., Zlobina N.V., Baev A.V., Artyushenko V.G., Yakimov B.P., Shirshin E.A. In vivo sensing of cutaneous edema: a comparative study of diffuse reflectance, Raman spectroscopy and multispectral imaging. J Biophotonics 2022; 15(1): e202100268, https://doi.org/10.1002/jbio.202100268.
- Li S., Ardabilian M., Zine A. Quantitative analysis of skin using diffuse reflectance for non-invasive pigments detection. In: Proceedings of the 16th International Joint Conference on Computer Vision, Imaging and Computer Graphics Theory and Applications (VISIGRAPP 2021). Vol. 4. 2021; p. 604–614, https://doi.org/10.5220/0010326806040614.
- Chae E.Y., Kim H.H., Sabir S., Kim Y., Kim H., Yoon S., Ye J.C., Cho S., Heo D., Kim K.H., Bae Y.M., Choi Y.W. Development of digital breast tomosynthesis and diffuse optical tomography fusion imaging for breast cancer detection. Sci Rep 2020; 10(1): 13127, https://doi.org/10.1038/s41598-020-70103-0.
- Zhang Q., Jiang H. Three-dimensional diffuse optical imaging of hand joints: system description and phantom studies. Opt Lasers Eng 2005; 43: 1237–1251, https://doi.org/10.1016/j.optlaseng.2004.12.007.
- Hoi J.W., Kim H.K., Fong C.J., Zweck L., Hielscher A.H. Non-contact dynamic diffuse optical tomography imaging system for evaluating lower extremity vasculature. Biomed Opt Express 2018; 9(11): 5597–5614, https://doi.org/10.1364/BOE.9.005597.
- Kurakina D., Perekatova V., Sergeeva E., Kostyuk A., Turchin I., Kirillin M. Probing depth in diffuse reflectance spectroscopy of biotissues: a Monte Carlo study. Laser Phys Lett 2022; 19: 035602, https://doi.org/10.1088/1612-202X/ac4be8.
- Blaney G., Sassaroli A., Fantini S. Dual-slope imaging in highly scattering media with frequency-domain near-infrared spectroscopy. Opt Lett 2020; 45(16): 4464–4467, https://doi.org/10.1364/OL.394829.
- Farrell T.J., Patterson M.S., Wilson B. A diffusion theory model of spatially resolved, steady-state diffuse reflectance for the noninvasive determination of tissue optical properties in vivo. Med Phys 1992; 19(4): 879–888, https://doi.org/10.1118/1.596777.
- Sergeeva E., Kurakina D., Turchin I., Kirillin M. A refined analytical model for reconstruction problems in diffuse reflectance spectroscopy. J Innov Opt Health Sci 2024; 17(05): 2342002, https://doi.org/10.1142/S1793545823420026.
- Post A.L., Faber D.J., Sterenborg H.J.C.M., van Leeuwen T.G. Subdiffuse scattering and absorption model for single fiber reflectance spectroscopy. Biomed Opt Express 2020; 11(11): 6620–6633, https://doi.org/10.1364/BOE.402466.
- Orlova A., Perevalova Y., Pavlova K., Orlinskaya N., Khilov A., Kurakina D., Shakhova M., Kleshnin M., Sergeeva E., Turchin I., Kirillin M. Diffuse optical spectroscopy monitoring of experimental tumor oxygenation after red and blue light photodynamic therapy. Photonics 2022; 9(1): 19, https://doi.org/10.3390/PHOTONICS9010019.
- Sekar S., Lanka P., Farina A., Mora A.D., Andersson-Engels S., Taroni P., Pifferi A. Broadband time domain diffuse optical reflectance spectroscopy: a review of systems, methods, and applications. Appl Sci 2019; 9(24): 5465, https://doi.org/10.3390/app9245465.
- Gioux S., Mazhar A., Cuccia D.J. Spatial frequency domain imaging in 2019: principles, applications, and perspectives. J Biomed Opt 2019; 24(7): 1–18, https://doi.org/10.1117/1.JBO.24.7.071613.
- Zhou X., Xia Y., Uchitel J., Collins-Jones L., Yang S., Loureiro R., Cooper R.J., Zhao H. Review of recent advances in frequency-domain near-infrared spectroscopy technologies [Invited]. Biomed Opt Express 2023; 14(7): 3234–3258, https://doi.org/10.1364/BOE.484044.
- van Veen R.L., Sterenborg H.J., Pifferi A., Torricelli A., Chikoidze E., Cubeddu R. Determination of visible near-IR absorption coefficients of mammalian fat using time- and spatially resolved diffuse reflectance and transmission spectroscopy. J Biomed Opt 2005; 10(5): 054004, https://doi.org/10.1117/1.2085149.
- Nogueira M.S., Maryam S., Amissah M., Lu H., Lynch N., Killeen S., O’Riordain M., Andersson-Engels S. Evaluation of wavelength ranges and tissue depth probed by diffuse reflectance spectroscopy for colorectal cancer detection. Sci Rep 2021; 11(1): 798, https://doi.org/10.1038/s41598-020-79517-2.
- Turchin I., Beschastnov V., Peretyagin P., Perekatova V., Kostyuk A., Orlova A., Koloshein N., Khilov A., Sergeeva E., Kirillin M., Ryabkov M. Multimodal optical monitoring of auto- and allografts of skin on a burn wound. Biomedicines 2023; 11(2): 351, https://doi.org/10.3390/biomedicines11020351.
- Bydlon T.M., Nachabé R., Ramanujam N., Sterenborg H.J., Hendriks B.H. Chromophore based analyses of steady-state diffuse reflectance spectroscopy: current status and perspectives for clinical adoption. J Biophotonics 2015; 8(1-2): 9–24, https://doi.org/10.1002/jbio.201300198.
- Jacques S.L. Optical properties of biological tissues: a review. Phys Med Biol 2013; 58(11): R37–R61. Corrected and republished from: Phys Med Biol 2013; 58(14): 5007–5008, https://doi.org/10.1088/0031-9155/58/11/R37.
- Nelson D.L., Cox M.M. Lehninger Biochemie. Springer Berlin Heidelberg, Berlin, Heidelberg; 2001.
- Assorted Spectra. URL: https://omlc.org/spectra/index.html.
- Wada H., Yoshizawa N., Ohmae E., Ueda Y., Yoshimoto K., Mimura T., Nasu H., Asano Y., Ogura H., Sakahara H., Goshima S. Water and lipid content of breast tissue measured by six-wavelength time-domain diffuse optical spectroscopy. J Biomed Opt 2022; 27(10): 105002, https://doi.org/10.1117/1.JBO.27.10.105002.
- Efendiev K., Alekseeva P., Linkov K., Shiryaev A., Pisareva T., Gilyadova A., Reshetov I., Voitova A., Loschenov V. Tumor fluorescence and oxygenation monitoring during photodynamic therapy with chlorin e6 photosensitizer. Photodiagnosis Photodyn Ther 2024; 45: 103969, https://doi.org/10.1016/j.pdpdt.2024.103969.
- Nachabé R., Evers D.J., Hendriks B.H., Lucassen G.W., van der Voort M., Wesseling J., Ruers T.J. Effect of bile absorption coefficients on the estimation of liver tissue optical properties and related implications in discriminating healthy and tumorous samples. Biomed Opt Express 2011; 2(3): 600–614, https://doi.org/10.1364/BOE.2.000600.
- Meineke G., Hermans M., Klos J., Lenenbach A., Noll R. A microfluidic opto-caloric switch for sorting of particles by using 3D-hydrodynamic focusing based on SLE fabrication capabilities. Lab Chip 2016; 16(5): 820–828, https://doi.org/10.1039/c5lc01478f.
- Chung S.H., Cerussi A.E., Klifa C., Baek H.M., Birgul O., Gulsen G., Merritt S.I., Hsiang D., Tromberg B.J. In vivo water state measurements in breast cancer using broadband diffuse optical spectroscopy. Phys Med Biol 2008; 53(23): 6713–6727, https://doi.org/10.1088/0031-9155/53/23/005.
- Davydov D.A., Budylin G.S., Baev A.V., Vaypan D.V., Seredenina E.M., Matskeplishvili S.T., Evlashin S.A., Kamalov A.A., Shirshin E.A. Monitoring the skin structure during edema in vivo with spatially resolved diffuse reflectance spectroscopy. J Biomed Opt 2023; 28(5): 057002, https://doi.org/10.1117/1.JBO.28.5.057002.
- Nachabé R., Hendriks B.H., Desjardins A.E., van der Voort M., van der Mark M.B., Sterenborg H.J. Estimation of lipid and water concentrations in scattering media with diffuse optical spectroscopy from 900 to 1,600 nm. J Biomed Opt 2010; 15(3): 037015, https://doi.org/10.1117/1.3454392.
- Pifferi A., Taroni P., Torricelli A., Messina F., Cubeddu R., Danesini G. Four-wavelength time-resolved optical mammography in the 680–980-nm range. Opt Lett 2003; 28(13): 1138–1140, https://doi.org/10.1364/ol.28.001138.
- Absorption spectrum of melanin. URL: https://www.cl.cam.ac.uk/~jgd1000/melanin.html.
- Zonios G., Dimou A., Bassukas I., Galaris D., Tsolakidis A., Kaxiras E. Melanin absorption spectroscopy: new method for noninvasive skin investigation and melanoma detection. J Biomed Opt 2008; 13(1): 014017, https://doi.org/10.1117/1.2844710.
- Marchesini R., Bono A., Carrara M. In vivo characterization of melanin in melanocytic lesions: spectroscopic study on 1671 pigmented skin lesions. J Biomed Opt 2009; 14(1): 014027, https://doi.org/10.1117/1.3080140.
- Lim L., Nichols B., Migden M.R., Rajaram N., Reichenberg J.S., Markey M.K., Ross M.I., Tunnell J.W. Clinical study of noninvasive in vivo melanoma and nonmelanoma skin cancers using multimodal spectral diagnosis. J Biomed Opt 2014; 19(11): 117003, https://doi.org/10.1117/1.JBO.19.11.117003.
- Bilirubin. URL: https://omlc.org/spectra/PhotochemCAD/html/119.html.
- Doumas B.T., Wu T.W., Jendrzejczak B. Delta bilirubin: absorption spectra, molar absorptivity, and reactivity in the diazo reaction. Clin Chem 1987; 33(6): 769–774.
- Banerjee A., Bhattacharyya N., Ghosh R., Singh S., Adhikari A., Mondal S., Roy L., Bajaj A., Ghosh N., Bhushan A., Goswami M., Ahmed A.S.A., Moussa Z., Mondal P., Mukhopadhyay S., Bhattacharyya D., Chattopadhyay A., Ahmed S.A., Mallick A.K., Pal S.K. Non-invasive estimation of hemoglobin, bilirubin and oxygen saturation of neonates simultaneously using whole optical spectrum analysis at point of care. Sci Rep 2023; 13(1): 2370, https://doi.org/10.1038/s41598-023-29041-w.
- Cruz-Landeira A., Bal M.J., Quintela O., López-Rivadulla M. Determination of methemoglobin and total hemoglobin in toxicological studies by derivative spectrophotometry. J Anal Toxicol 2002; 26(2): 67–72, https://doi.org/10.1093/jat/26.2.67.
- Sekar S.K., Bargigia I., Mora A.D., Taroni P., Ruggeri A., Tosi A., Pifferi A., Farina A. Diffuse optical characterization of collagen absorption from 500 to 1700 nm. J Biomed Opt 2017; 22(1): 15006, https://doi.org/10.1117/1.JBO.22.1.015006.
- Nazarov D.A., Denisenko G.M., Budylin G.S., Kozlova E.A., Lipina M.M., Lazarev V.A., Shirshin E.A., Tarabrin M.K. Diffuse reflectance spectroscopy of the cartilage tissue in the fourth optical window. Biomed Opt Express 2023; 14(4): 1509–1521, https://doi.org/10.1364/BOE.483135.
- Taroni P., Quarto G., Pifferi A., Ieva F., Paganoni A.M., Abbate F., Balestreri N., Menna S., Cassano E., Cubeddu R. Optical identification of subjects at high risk for developing breast cancer. J Biomed Opt 2013; 18(6): 060507, https://doi.org/10.1117/1.JBO.18.6.060507.
- Martínez-Mancera F., Hernandez-Lopez J. In vitro observation of direct electron transfer of human haemoglobin molecules on glass/tin-doped indium oxide electrodes. J Mex Chem Soc 2015; 59(4), https://doi.org/10.29356/jmcs.v59i4.87.
- Amenhotep Z.D. Hematology and coagulation. In: Self-assessment Q and A in clinical laboratory science, III. Elsevier; 2021; p. 295–313, https://doi.org/10.1016/b978-0-12-822093-1.00025-9.
- Mentzer W.C., Glader B.E. Erythrocyte disorders in infancy. In: Taeusch H.W., Ballard R.A., Gleason C.A. (editors). Avery’s diseases of the newborn. W.B. Saunders; 2005; р. 1180–1214, https://doi.org/10.1016/B978-072169347-7.50079-2.
- Vasudevan S., Campbell C., Liu F., O’Sullivan T.D. Broadband diffuse optical spectroscopy of absolute methemoglobin concentration can distinguish benign and malignant breast lesions. J Biomed Opt 2021; 26(6): 065004, https://doi.org/10.1117/1.JBO.26.6.065004.
- Barham P., Skibsted L.H., Bredie W.L., Frøst M.B., Møller P., Risbo J., Snitkjaer P., Mortensen L.M. Molecular gastronomy: a new emerging scientific discipline. Chem Rev 2010; 110(4): 2313–2365, https://doi.org/10.1021/cr900105w.
- Arakaki L.S., Schenkman K.A., Ciesielski W.A., Shaver J.M. Muscle oxygenation measurement in humans by noninvasive optical spectroscopy and locally weighted regression. Anal Chim Acta 2013; 785: 27–33, https://doi.org/10.1016/j.aca.2013.05.003.
- Wang L., Santos E., Schenk D., Rabago-Smith M. Kinetics and mechanistic studies on the reaction between cytochrome c and tea catechins. Antioxidants (Basel) 2014; 3(3): 559–568, https://doi.org/10.3390/antiox3030559.
- Arai A.E., Kasserra C.E., Territo P.R., Gandjbakhche A.H., Balaban R.S. Myocardial oxygenation in vivo: optical spectroscopy of cytoplasmic myoglobin and mitochondrial cytochromes. Am J Physiol 1999; 277(2): H683–H697, https://doi.org/10.1152/ajpheart.1999.277.2.H683.
- Bhattacharya M., Dutta A. Computational modeling of the photon transport, tissue heating, and cytochrome c oxidase absorption during transcranial near-infrared stimulation. Brain Sci 2019; 9(8): 179, https://doi.org/10.3390/brainsci9080179.
- Lindbergh T., Häggblad E., Ahn H., Göran Salerud E., Larsson M., Strömberg T. Improved model for myocardial diffuse reflectance spectra by including mitochondrial cytochrome aa3, methemoglobin, and inhomogenously distributed RBC. J Biophotonics 2011; 4(4): 268–276, https://doi.org/10.1002/jbio.201000048.
- Lee J., Kim J.G., Mahon S.B., Mukai D., Yoon D., Boss G.R., Patterson S.E., Rockwood G., Isom G., Brenner M. Noninvasive optical cytochrome c oxidase redox state measurements using diffuse optical spectroscopy. J Biomed Opt 2014; 19(5): 055001, https://doi.org/10.1117/1.JBO.19.5.055001.
- Cerussi A., Shah N., Hsiang D., Durkin A., Butler J., Tromberg B.J. In vivo absorption, scattering, and physiologic properties of 58 malignant breast tumors determined by broadband diffuse optical spectroscopy. J Biomed Opt 2006; 11(4): 044005, https://doi.org/10.1117/1.2337546.
- Khan M.I.H., Karim M.A. Cellular water distribution, transport, and its investigation methods for plant-based food material. Food Res Int 2017; 99(Pt 1): 1–14, https://doi.org/10.1016/j.foodres.2017.06.037.
- Yang C.C., Yen Y.Y., Hsu C.K., Cheng N.Y., Tzeng S.Y., Chou S.J., Chang J.M., Tseng S.H. Investigation of water bonding status of normal and psoriatic skin in vivo using diffuse reflectance spectroscopy. Sci Rep 2021; 11(1): 8901, https://doi.org/10.1038/s41598-021-88530-y.
- Akter S., Hossain Md.G., Nishidate I., Hazama H., Awazu K. Medical applications of reflectance spectroscopy in the diffusive and sub-diffusive regimes. J Infrared Spectrosc 2018; 26(6): 337–350, https://doi.org/10.1177/0967033518806637.
- Beauvoit B., Evans S.M., Jenkins T.W., Miller E.E., Chance B. Correlation between the light scattering and the mitochondrial content of normal tissues and transplantable rodent tumors. Anal Biochem 1995; 226(1): 167–174, https://doi.org/10.1006/abio.1995.1205.
- Wilson J.D., Cottrell W.J., Foster T.H. Index-of-refraction-dependent subcellular light scattering observed with organelle-specific dyes. J Biomed Opt 2007; 12(1): 014010, https://doi.org/10.1117/1.2437765.
- Blaney G., Bottoni M., Sassaroli A., Fernandez C., Fantini S. Broadband diffuse optical spectroscopy of two-layered scattering media containing oxyhemoglobin, deoxyhemoglobin, water, and lipids. J Innov Opt Health Sci 2022; 15(3): 2250020, https://doi.org/10.1142/s1793545822500201.
- Lam J.H., Tu K.J., Kim S. Narrowband diffuse reflectance spectroscopy in the 900–1000 nm wavelength region to quantify water and lipid content of turbid media. Biomed Opt Express 2021; 12(6): 3091–3102, https://doi.org/10.1364/BOE.425451.
- Bhagavan N.V. Protein and amino acid metabolism. In: Medical biochemistry. Academic Press; 2002; p. 331–363, https://doi.org/10.1016/b978-012095440-7/50019-6.
- Maranduca M.A., Branisteanu D., Serban D.N., Branisteanu D.C., Stoleriu G., Manolache N., Serban I.L. Synthesis and physiological implications of melanic pigments. Oncol Lett 2019; 17(5): 4183–4187, https://doi.org/10.3892/ol.2019.10071.
- Kalia S., Zhao J., Zeng H., McLean D., Kollias N., Lui H. Melanin quantification by in vitro and in vivo analysis of near-infrared fluorescence. Pigment Cell Melanoma Res 2018; 31(1): 31–38, https://doi.org/10.1111/pcmr.12624.
- Gell D.A. Structure and function of haemoglobins. Blood Cells Mol Dis 2018; 70: 13–42, https://doi.org/10.1016/j.bcmd.2017.10.006.
- Chan E.D., Chan M.M., Chan M.M. Pulse oximetry: understanding its basic principles facilitates appreciation of its limitations. Respir Med 2013; 107(6): 789–799, https://doi.org/10.1016/j.rmed.2013.02.004.
- Orlova A.G., Kirillin M.Y., Volovetsky A.B., Shilyagina N.Y., Sergeeva E.A., Golubiatnikov G.Y., Turchin I.V. Diffuse optical spectroscopy monitoring of oxygen state and hemoglobin concentration during SKBR-3 tumor model growth. Laser Phys Lett 2016; 14: 015601, https://doi.org/10.1088/1612-202X/AA4FC1.
- Diaz P.M., Jenkins S.V., Alhallak K., Semeniak D., Griffin R.J., Dings R.P.M., Rajaram N. Quantitative diffuse reflectance spectroscopy of short-term changes in tumor oxygenation after radiation in a matched model of radiation resistance. Biomed Opt Express 2018; 9(8): 3794–3804, https://doi.org/10.1364/BOE.9.003794.
- Cochran J.M., Busch D.R., Leproux A., Zhang Z., O’Sullivan T.D., Cerussi A.E., Carpenter P.M., Mehta R.S., Roblyer D., Yang W., Paulsen K.D., Pogue B., Jiang S., Kaufman P.A., Chung S.H., Schnall M., Snyder B.S., Hylton N., Carp S.A., Isakoff S.J., Mankoff D., Tromberg B.J., Yodh A.G. Tissue oxygen saturation predicts response to breast cancer neoadjuvant chemotherapy within 10 days of treatment. J Biomed Opt 2018; 24(2): 1–11, https://doi.org/10.1117/1.JBO.24.2.021202.
- Brown J.M., Wilson W.R. Exploiting tumour hypoxia in cancer treatment. Nat Rev Cancer 2004; 4(6): 437–447, https://doi.org/10.1038/nrc1367.
- Khatun F., Aizu Y., Nishidate I. Transcutaneous monitoring of hemoglobin derivatives during methemoglobinemia in rats using spectral diffuse reflectance. J Biomed Opt 2021; 26(3): 033708, https://doi.org/10.1117/1.JBO.26.3.033708.
- Arakaki L.S., Burns D.H., Kushmerick M.J. Accurate myoglobin oxygen saturation by optical spectroscopy measured in blood-perfused rat muscle. Appl Spectrosc 2007; 61(9): 978–985, https://doi.org/10.1366/000370207781745928.
- Baranoski G.V., Chen T.F., Kimmel B.W., Miranda E., Yim D. On the noninvasive optical monitoring and differentiation of methemoglobinemia and sulfhemoglobinemia. J Biomed Opt 2012; 17(9): 97005, https://doi.org/10.1117/1.JBO.17.9.097005.
- Niemann M.J., Sørensen H., Siebenmann C., Lundby C., Secher N.H. Carbon monoxide reduces near-infrared spectroscopy determined ‘total’ hemoglobin: a human volunteer study. Scand J Clin Lab Invest 2017; 77(4): 259–262, https://doi.org/10.1080/00365513.2017.1299209.
- Allred E.N., Bleecker E.R., Chaitman B.R., Dahms T.E., Gottlieb S.O., Hackney J.D., Pagano M., Selvester R.H., Walden S.M., Warren J. Short-term effects of carbon monoxide exposure on the exercise performance of subjects with coronary artery disease. N Engl J Med 1989; 321(21): 1426–1432. Corrected and republished from: N Engl J Med 1990; 322(14): 1019, https://doi.org/10.1056/NEJM198911233212102.
- Dervieux E., Bodinier Q., Uhring W., Théron M. Measuring hemoglobin spectra: searching for carbamino-hemoglobin. J Biomed Opt 2020; 25(10): 105001, https://doi.org/10.1117/1.JBO.25.10.105001.
- Da-Silva S.S., Sajan I.S., Underwood J.P. 3rd. Congenital methemoglobinemia: a rare cause of cyanosis in the newborn — a case report. Pediatrics 2003; 112(2): e158–e161, https://doi.org/10.1542/peds.112.2.e158.
- Lee J., El-Abaddi N., Duke A., Cerussi A.E., Brenner M., Tromberg B.J. Noninvasive in vivo monitoring of methemoglobin formation and reduction with broadband diffuse optical spectroscopy. J Appl Physiol (1985) 2006; 100(2): 615–622, https://doi.org/10.1152/japplphysiol.00424.2004.
- Parvez M.A., Yashiro K., Tsunoi Y., Saitoh D., Sato S., Nishidate I. In vivo monitoring of hemoglobin derivatives in a rat thermal injury model using spectral diffuse reflectance imaging. Burns 2024; 50(1): 167–177, https://doi.org/10.1016/j.burns.2023.07.006.
- Wilson M.T., Reeder B.J. Myoglobin. In: Encyclopedia of respiratory medicine. Academic Press; 2006; p. 73–76, https://doi.org/10.1016/B0-12-370879-6/00250-7.
- Lin L., Yao J., Li L., Wang L.V. In vivo photoacoustic tomography of myoglobin oxygen saturation. J Biomed Opt 2016; 21(6): 61002, https://doi.org/10.1117/1.JBO.21.6.061002.
- Denzer M.L., Piao D., Pfeiffer M., Mafi G., Ramanathan R. Novel needle-probe single-fiber reflectance spectroscopy to quantify sub-surface myoglobin forms in beef psoas major steaks during retail display. Meat Sci 2024; 210: 109439, https://doi.org/10.1016/j.meatsci.2024.109439.
- Gemoliticheskaya bolezn’ ploda i novorozhdennogo: diagnostika, lechenie, profilaktika [Hemolytic disease of the fetus and newborn: diagnostics, treatment, prevention]. Pod red. Volodina N.N. [Volodin N.N. (editor)]. Moscow; 2021.
- Groenendaal F., van der Grond J., de Vries L.S. Cerebral metabolism in severe neonatal hyperbilirubinemia. Pediatrics 2004; 114(1): 291–294, https://doi.org/10.1542/peds.114.1.291.
- Rubaltelli F.F., Gourley G.R., Loskamp N., Modi N., Roth-Kleiner M., Sender A., Vert P. Transcutaneous bilirubin measurement: a multicenter evaluation of a new device. Pediatrics 2001; 107(6): 1264–1271, https://doi.org/10.1542/peds.107.6.1264.
- Gibson A.P., Hebden J.C., Arridge S.R. Recent advances in diffuse optical imaging. Phys Med Biol 2005; 50(4): R1–R43, https://doi.org/10.1088/0031-9155/50/4/r01.
- Bale G., Elwell C.E., Tachtsidis I. From Jöbsis to the present day: a review of clinical near-infrared spectroscopy measurements of cerebral cytochrome-c-oxidase. J Biomed Opt 2016; 21(9): 091307, https://doi.org/10.1117/1.JBO.21.9.091307.
- Michel H., Behr J., Harrenga A., Kannt A. Cytochrome c oxidase: structure and spectroscopy. Annu Rev Biophys Biomol Struct 1998; 27: 329–356, https://doi.org/10.1146/annurev.biophys.27.1.329.
- Tisdall M.M., Tachtsidis I., Leung T.S., Elwell C.E., Smith M. Increase in cerebral aerobic metabolism by normobaric hyperoxia after traumatic brain injury. J Neurosurg 2008; 109(3): 424–432, https://doi.org/10.3171/JNS/2008/109/9/0424.
- Shin’oka T., Nollert G., Shum-Tim D., du Plessis A., Jonas R.A. Utility of near-infrared spectroscopic measurements during deep hypothermic circulatory arrest. Ann Thorac Surg 2000; 69(2): 578–583, https://doi.org/10.1016/s0003-4975(99)01322-3.
- Yamada T., Takakura H., Jue T., Hashimoto T., Ishizawa R., Furuichi Y., Kato Y., Iwanaka N., Masuda K. Myoglobin and the regulation of mitochondrial respiratory chain complex IV. J Physiol 2016; 594(2): 483–495, https://doi.org/10.1113/JP270824.
- Arakaki L.S., Ciesielski W.A., Thackray B.D., Feigl E.O., Schenkman K.A. Simultaneous optical spectroscopic measurement of hemoglobin and myoglobin saturations and cytochrome aa3 oxidation in vivo. Appl Spectrosc 2010; 64(9): 973–979, https://doi.org/10.1366/000370210792434387.